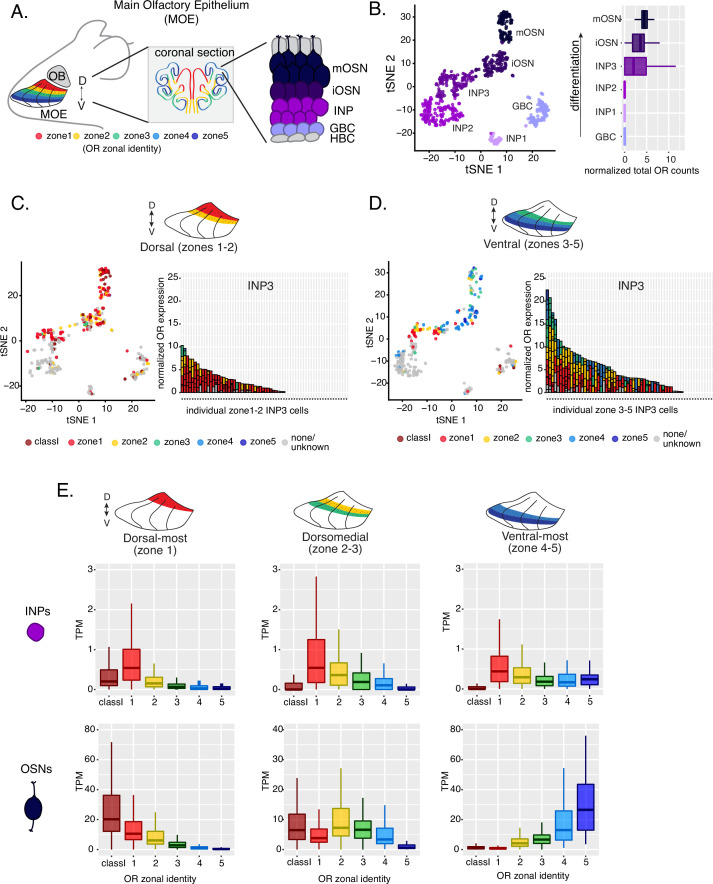
Figure 1. Polygenic transcription of olfactory receptor (OR) genes in olfactory progenitors follows a zonal expression pattern.
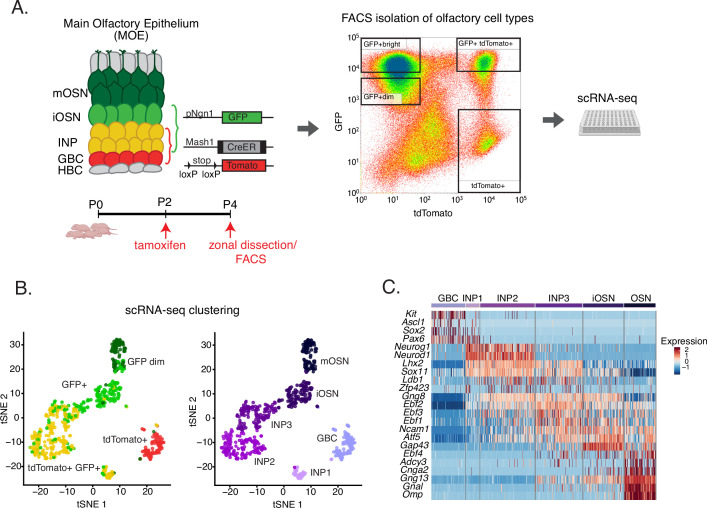
(A) Schematic illustrating OR zones along the dorsoventral axis in whole mount views of the MOE (left) and coronal sections (middle). Zone 1 (red) is the dorsal-most zone and zone 5 (blue) is the ventral-most zone. Zoomed-in view of the MOE (right) shows cell populations at different stages of olfactory sensory neuron (OSN) differentiation organized in a pseudostratified fashion from the basal (least differentiated) to apical (most differentiated) layers: HBC, horizontal basal cell; GBC, globose basal cell; INP, immediate neuronal precursor; iOSN, immature olfactory sensory neuron; mOSN, mature olfactory sensory neuron. MOE: main olfactory epithelium, OB: olfactory bulb. (B) t-SNE (t-distributed Stochastic Neighborhood Embedding) dimensionality reduction used to visualize the clustering of single cells from FAC-sorted MOE cell populations with Seurat, based on expression of the most variable genes. Plot (left panel) shows the separation of single cells into six populations, to which we assigned cell identities based on the expression of known MOE markers (Fletcher et al., 2017) (See also Figure 1—figure supplement 1). Olfactory receptor expression is first detected in INP3 cells (right panel). (C, D, left panel) t-SNE plot (as in B) of cell populations isolated from either dorsal (zones 1–2) in (C) or ventral (zones 3–5) in (D) MOE microdissections. Cells are colored according to the zonal identity of the most highly expressed OR. (C, D, right panel) Plots depicting zonal identities of all the OR genes detected in individual INP3 cells from dorsal (C) or ventral (D) MOE. Y-axis shows OR expression in normalized counts of unique transcripts (UMIs) for different OR genes (separated by black lines). On the X-axis, each point is a different INP3 cell. ORs are colored according to their zonal identity. Note that while class I OR genes are expressed within zone 1 of the MOE, they may be regulated through a different mechanism and are thus displayed separately. Single-cell analysis shows data from two biological replicates. (E) Expression of OR genes of different zonal identities in olfactory progenitor INP cells (top) and mOSNs (bottom), determined with bulk RNA-seq, in cells isolated from dorsal-most (zone 1) (left), dorsomedial (zones 2–3) (middle), and ventral-most (zones 4–5) MOE microdissections (right). Note that INP and mOSN cells were FAC-sorted from the same exact dissection, thus the mOSN OR expression patterns confirm the accuracy of the dissection. RNA-seq was performed on INP and mOSNs from two or three biological replicates (from dorsal-most and ventral-most MOE segments or dorsomedial MOE segments, respectively).


