. 2023 Dec 18;12:RP87445. doi: 10.7554/eLife.87445

Figure 2. Heterochromatin deposition silences olfactory receptor (OR) genes from lower zones.

(A) Signal tracks of H3K9me3 and H3K79me3 native ChIP-seq from the whole main olfactory epithelium (MOE) show heterochromatin deposition over two representative OR gene clusters. These clusters were selected because they harbor OR genes with both dorsal (zone 1) and ventral (zone 5) identities. OR genes are colored according to their zonal identity: zone 1 ORs in red, zone 2 ORs in yellow, zone 5 ORs in blue, and ORs with unknown zonal identity in gray. Purple triangle marks the ‘H’ OR gene enhancer that is present within that OR gene cluster. (B) H3K9me3 (left) and H3K79me3 (right) native ChIP-seq in the whole MOE. Box plots of read density over OR gene bodies, separated by their zonal identity, depict a pattern of deposition that is high on dorsal-most (zone 1) OR genes, progressively decreases with more ventral zonal OR identities, and is absent on class I ORs. (C) H3K79me3 native ChIP seq in globose basal cell (GBC), immediate neuronal precursor (INP), immature OSN (iOSN), and mature OSNs (mOSN) populations shows an onset of H3K79me3 deposition as cells transition from INPs to iOSNs. Each row of the heatmaps shows coverage over an OR gene body (separated into categories by their zonal identity). (See also Figure 2—figure supplement 1A for H3K9me3 heatmap). (D) H3K79me3 native ChIP-seq in mOSNs from zonally dissected MOE. Colored schematics above each heatmap depict the zone of dissection. (See also Figure 2—figure supplement 1B for H3K9me3 heatmap). (A–D) Pooled data from two biological replicates is shown for all ChIP experiments.

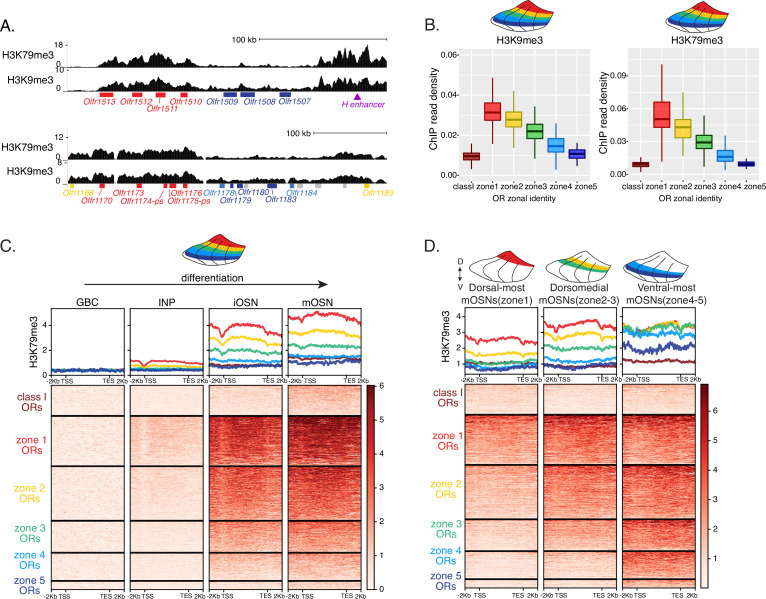
Figure 2.

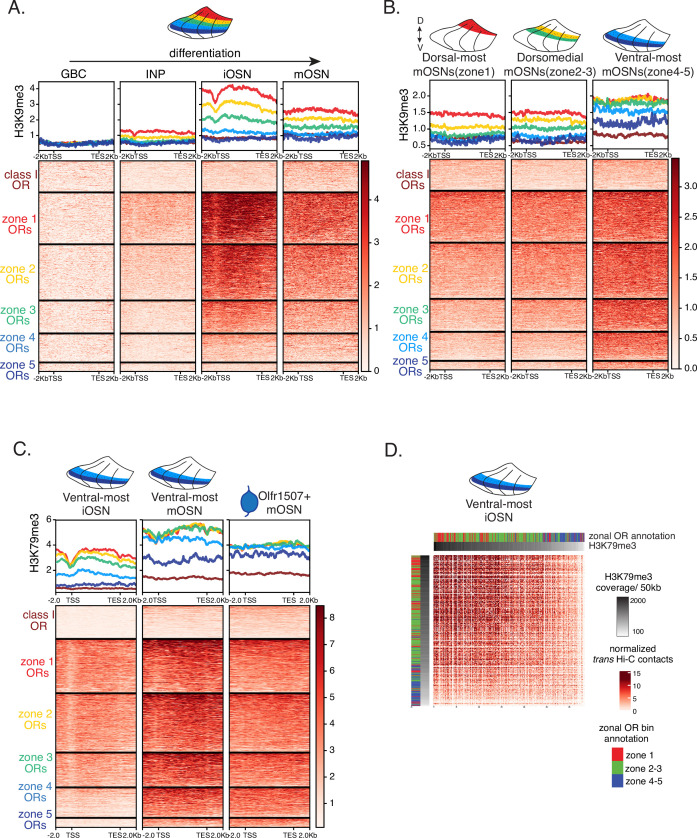
Figure 2—figure supplement 1. Progressive accumulation of heterochromatin on olfactory receptor (OR) genes in space and time.

Figure 2—figure supplement 1.

(A) H3K9me3 native ChIP seq in globose basal cell (GBC), immediate neuronal precursor (INP), immature OSN (iOSN), and mature OSN (mOSN) populations shows a similar onset of deposition to that of H3K79me3. Each row of the heatmaps shows coverage over an OR gene body (scaled to 6 kb with 2 kb flanking on either side), separated into categories by their zonal identity. (B) H3K9me3 native ChIP-seq in mOSNs from zonally dissected main olfactory epithelium (MOE). Colored schematics above each heatmap depict the zone of dissection. (C) H3K79me3 native ChIP-seq in cells at different developmental stages from ventral-most dissected MOE: iOSN (left), mOSN (middle), and a pure population of Olfr1507-expressing mOSNs (a zone 5 OR) (right). H3K79me3 heterochromatin is absent from zone 5 ORs in ventral-most iOSNs and is deposited progressively as the cells mature. (D) Increased H3K79me3 deposition is correlated with increased interchromosomal interactions between OR gene loci. Heatmap of normalized interchromosomal Hi-C contacts between OR cluster bins. Each bin is ordered by H3K79me3 ChIP signal (gray color bar on top) and annotated according to the zonal identity of its resident OR genes: zone 1 ORs, red; zone 2-3 ORs, green; zone 4-5 ORs, blue. Class I OR genes (which are also expressed in zone 1) make few interchromosomal interactions throughout all zones of the MOE and were thus excluded from this analysis. OR cluster regions that have higher levels of H3K79me3 and are enriched for zone 1 ORs have increased trans Hi-C contacts. (A–D) Pooled data from two biological replicates is shown for all ChIP experiments.