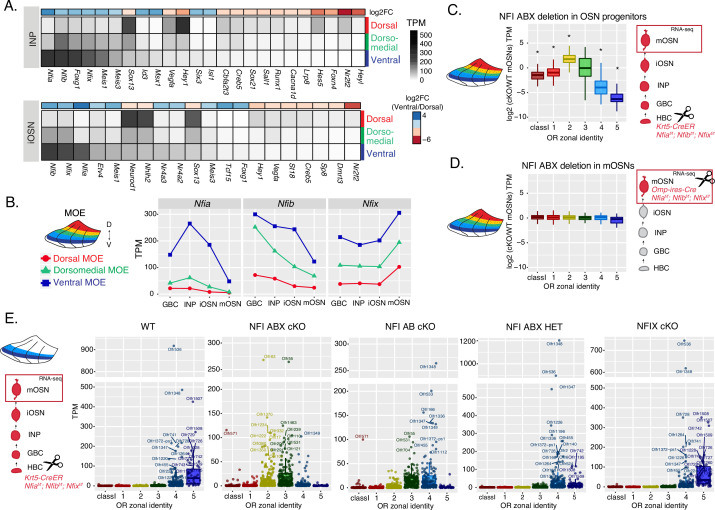
Figure 4. NFI paralogue gradients regulate zonal olfactory receptor (OR) expression.
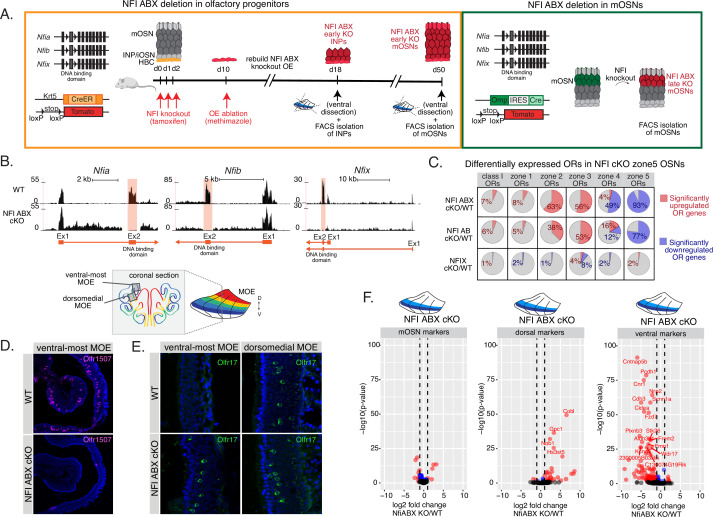
(A) Heatmaps showing differentially expressed transcription factors in the immediate neuronal precursor (INP) and immature olfactory sensory neuron (iOSN) cells isolated from the either dorsal, dorsomedial, or ventral olfactory epithelium. The shown transcription factors are significantly differentially expressed between dorsal and ventral cells with an adjusted p-value of <0.05, at least a threefold change in expression, and an expression level of at least 15 TPM (transcripts per million). Adjusted p-values use the Benjamini-Hochberg method to control for multiple hypothesis testing. A broader list of zonal transcription factors is included in Supplementary file 1. The heatmaps are sorted based on expression in ventral cells and the color bar above each heatmap shows the log2 fold change in ventral cells relative to dorsal cells. Three biological replicates were analyzed for INP and iOSNs from dorsal-most and ventral-most main olfactory epithelium (MOE), and two biological replicates were analyzed for INP and iOSNs from dorsomedial MOE. (B) Expression levels of Nfia, Nfib, and Nfix at four stages of olfactory sensory neuron (OSN) development in dorsal cells (red), dorsomedial cells (green) and ventral cells (blue). (C, D) Comparison of OR gene expression in NFI ABX triple knockout (Nfia, Nfib, and Nfix deletion) and control cells from the whole MOE. NFI transcription factors are deleted either in olfactory progenitors (C) using the Krt5-CreER driver or in mOSNs (D) using the Omp-IRES-Cre driver (as illustrated in Figure 4—figure supplement 1). At the right of each panel, scissors indicate the differentiation stage of Nfia, Nfib, and Nfix deletion, and a red box marks the cell type that was FAC-sorted for RNA-seq analysis. Two biological replicates were compared for NFI ABX triple knockout in olfactory progenitors and controls (C), and three biological replicates were compared for NFI ABX triple knockout in mOSNs and controls (D). Wilcoxon rank sum test: *p-value <0.01 [Benjamini-Hochberg FDR = 0.05]. (E) OR expression in NFI ABX triple knockout, NFI AB double knockout, NFIX knockout, NFI ABX triple heterozygous and control mOSNs from ventrally dissected MOE. Knockout was induced in progenitors with the Krt5-CreER driver. Plots show a different pattern of OR gene transcription in the different genotypes. Quantification of differentially expressed ORs for the three knockout genotypes is shown in Figure 4—figure supplement 1. Three biological replicates were compared for NFI ABX triple knockout mOSNs, two replicates for NFI AB double knockout, NFIX knockout, and NFI ABX triple heterozygous mOSNs, and four replicates for control mOSNs.


