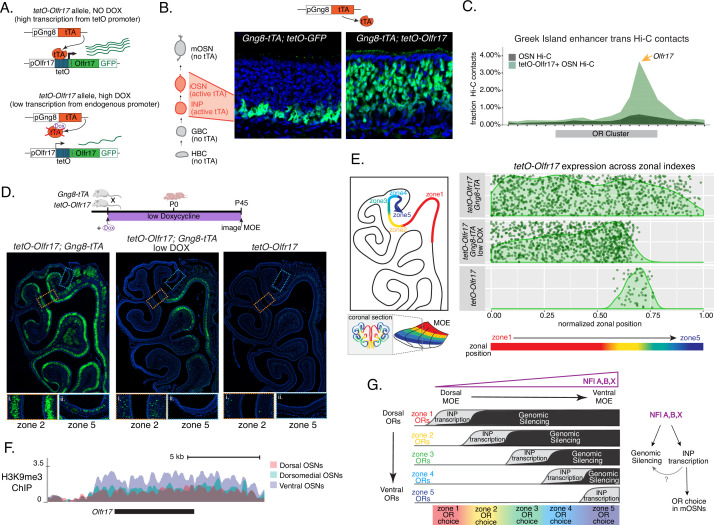
Figure 7. Genetic induction of olfactory receptor (OR) transcription in olfactory progenitors determines OR choice in mature OSNs (mOSNs).
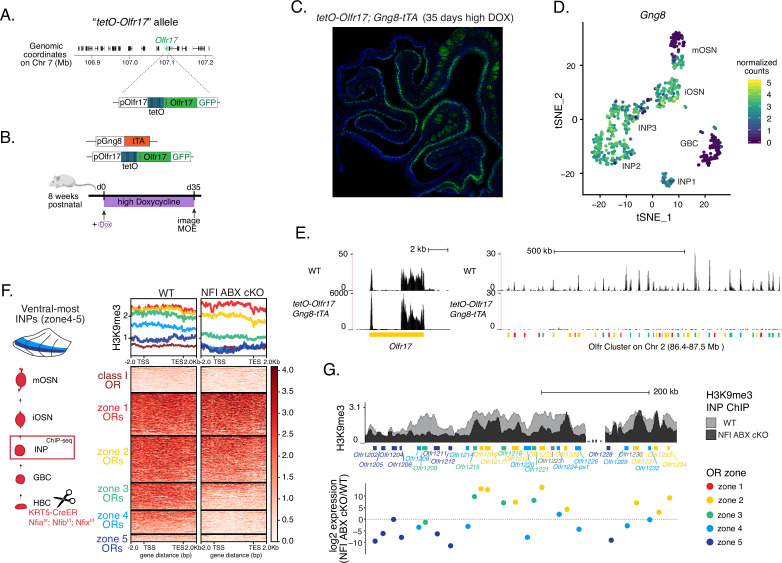
(A) Genetic strategy for transcriptional induction of OR Olfr17 (a zone 2 identity OR) from its endogenous genomic locus. A genetically modified ‘tetO-Olfr17’ allele contains a tetO promoter immediately downstream of the endogenous Olfr17 promoter and an IRES GFP reporter after the coding sequence (Fleischmann et al., 2013). In the presence of tTA a high level of tetO-Olfr17 is induced from the tetO promoter (top), while in the presence of a high amount of doxycycline (DOX) tTA is inhibited and transcription is regulated by the endogenous promoter. See also Figure 7—figure supplement 1A for information on the genomic locus of this Olfr17 allele. (B) tTA driven by the Gng8 promoter is expressed in immediate neuronal precursor (INP) and immature OSN (iOSN) cells in the main olfactory epithelium (MOE) (Tirindelli and Ryba, 1996). When Gng8-tTA drives the expression of a tetO-GFP allele, transcription is detected only in progenitor cells located on the basal side of the MOE, where the tTA is expressed (left) (Nguyen et al., 2010). In contrast, when Gng8-tTA drives the expression of tetO-Olfr17, expression persists in mature OSNs where tTA is no longer present (right). See also Figure 7—figure supplement 1B–C for the sustained and widespread expression of the tetO-Olfr17 allele after 35 days of high DOX treatment and Figure 7—figure supplement 1D for Gng8 expression during OSN differentiation. (C) In situ Hi-C in tetO-Olfr17 expressing cells shows enriched contacts with interchromosomal olfactory receptor (‘Greek Island’) enhancers over the Olfr17 locus, suggesting tetO-Olfr17 + OSNs are using endogenous mechanisms to sustain Olfr17 expression after Gng8-tTA is no longer present. (D) tetO-Olfr17 expression in coronal sections of the MOE determined by GFP fluorescence. In the absence of tTA tetO-Olfr17 expression occurs only in zone 2 of the MOE (right); with high tTA induction in progenitor cells tetO-Olfr17 expression occurs throughout all zones of the MOE (left); and with low tTA induction in progenitor cells, due to the addition of a low amount of doxycycline, tetO-Olfr17 expression occurs in zone 2 and spreads dorsally to zone 1 (middle) only. Magnified views show tetO-Olfr17 expression in its native zone 2 (i) and ectopic expression in the most ventral zone 5 (ii). Mice on low doxycycline (DOX) treatment were provided doxycycline at 1 ug/ml in water throughout gestation and postnatal life. (E) Quantification of tetO-Olfr17 expression (determined by GFP fluorescence in immunofluorescence images) relative to a normalized zonal position (illustrated on the left) in coronal sections of the MOE from tetO-Olfr17 without tTA driver (bottom), tetO-Olfr17 with Gng8-tTA driver (top), and tetO-Olfr17 with Gng8-tTA driver on low DOX (middle). Six sections from two replicates were analyzed for tetO-Olfr17 with Gng8-tTA; 9 sections from two replicates were analyzed from tetO-Olfr17 with Gng8-tTA and low DOX; 29 sections from two replicates were analyzed for tetO-Olfr17 without tTA. The plot displays a maximum of 1000 cells randomly selected for each condition. (F) H3K9me3 native ChIP signal over the Olfr17 locus in mOSNs from dorsal (red), dorsomedial (green), and ventral (blue) MOE shows a higher level of heterochromatin in ventral MOE. (G) Model of OR choice in each zone of the MOE, regulated by the interplay of low-level polygenic OR transcription in INP cells, which defines the OR repertoire that can be chosen in each zone, and heterochromatic silencing, which prevents ectopic expression of more dorsal ORs. Both polygenic OR transcription in INP cells and heterochromatin deposition are influenced by NFI A, B, and X transcription factors, expressed in a dorsal-low ventral-high gradient across the MOE.


