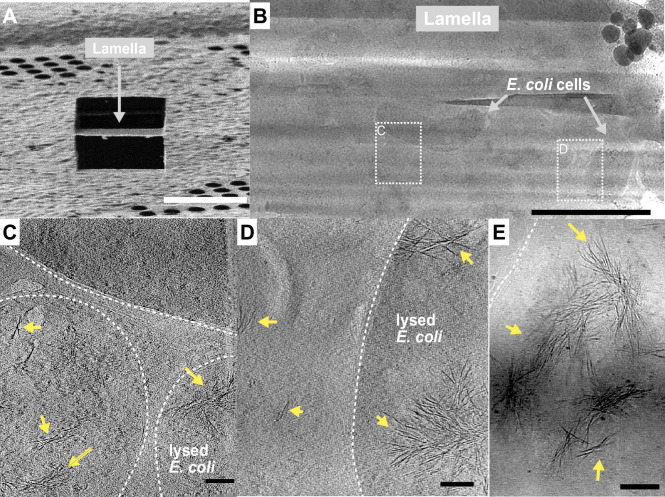
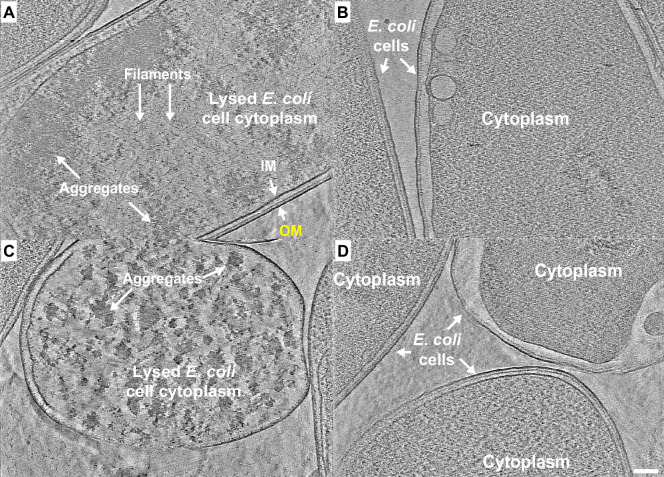
Figure 8. Fibrous bundles observed by cryo-focused-ion-beam (cryo-FIB) and cryo-electron tomography (cryo-ET) in in E. coli cells expressing ice nucleation protein (INP).
(A) Ion-beam image of a thin lamella containing E. coli cells expressing INP obtained from cryo-FIB milling. (B) Zoomed-in view of a cryo-transmission electron microscopy (TEM) image of the lamella in (A). Boxes with dashed lines indicate areas where tilt series were collected. (C, D) Snapshots from 3D cryo-tomograms reconstructed from tilt series collected in the boxed regions in (B) showing striking fibrous bundles (yellow arrowheads). The E. coli cell envelopes are indicated with thick dash lines. (E) Further examples of the fibrous bundles produced by INP-expressing E. coli. Size markers in (A) is 10 µm, in (B) is 2 µm, and in (C), (D), and (E) are 100 nm, respectively.


