
Figure 13. GDNF normalizes altered intestinal motility by increasing NENs proportions in the aging gut.
(a) Measures of whole gut transit time (WGTT) in GDNF (treated with GDNF) and Control (treated with Saline) cohorts of 17-month-old mice taken before the start of treatments and after the end of 10 consecutive days of treatment shows that the two groups are matched in their transit times before treatment, but GDNF treatment significant decreases average transit times when compared to the control cohort. Data represent mean ± S.E.M. Student’s t-test ***=p < 0.001. (b) Quantification of percent MHCst+ MENs per Hu-labeled neurons in myenteric ganglia in the GDNF and Control cohorts shows significant decrease in their proportions in GDNF-treated cohort but not in saline-treated control cohort. Data represent mean ± S.E.M. Student’s t-test ** p<0.01. (c) Quantification of numbers of RET+ NENs per 40 X field views of myenteric ganglia shows significant increase in their numbers in GDNF cohort mice when compared with Control cohort mice. Data represent mean ± S.E.M. Student’s t-test * p<0.05.
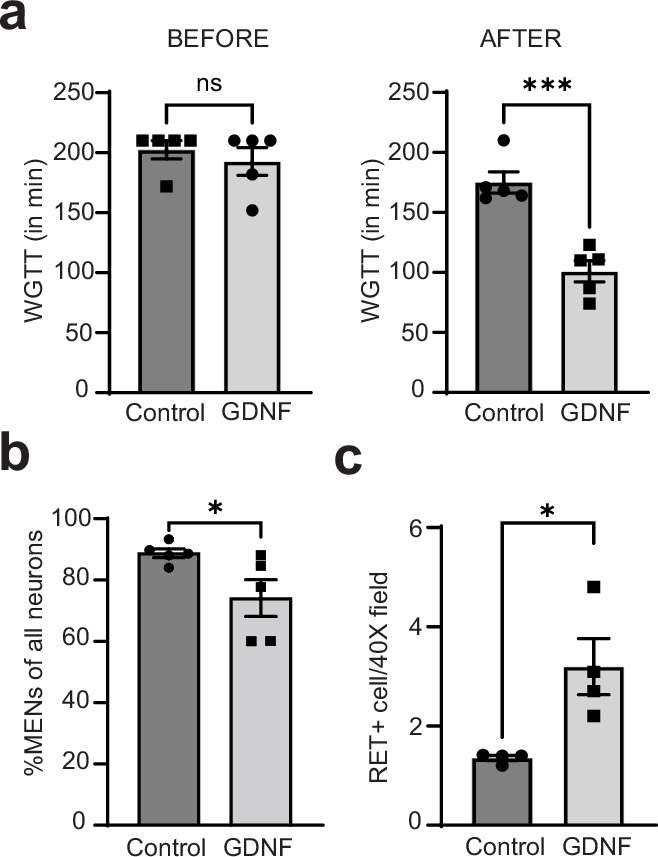
Figure 13—figure supplement 1. Effect of GDNF treatment on MHCst-expressing MENs and RET-expressing NENs in aging mice.
