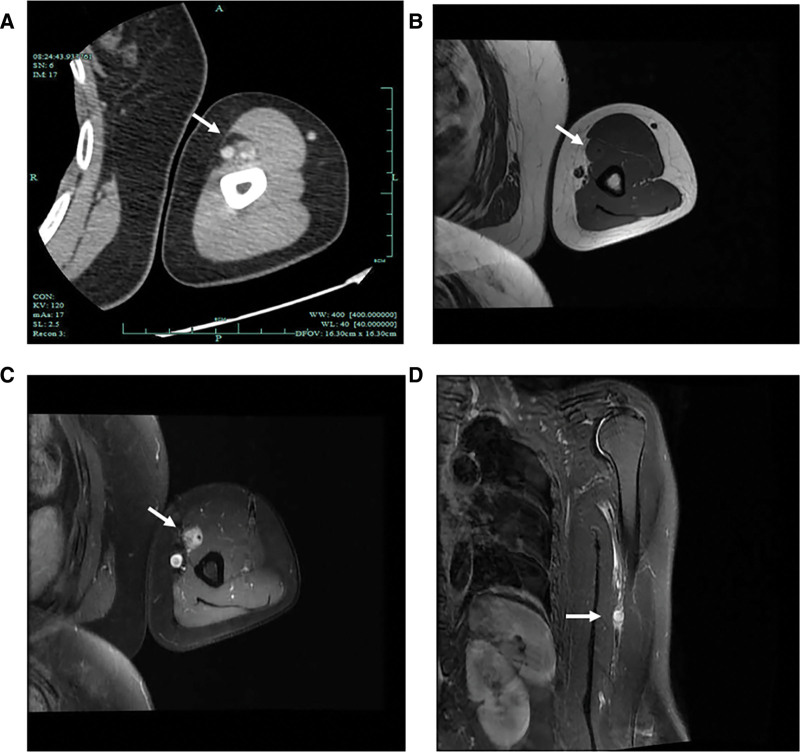
Figure 2.
Computed tomography (CT) and magnetic resonance imaging (MRI) of the tumor. (A) Contrast-enhanced CT of the left upper limb shows nodular soft tissue density shadow inside the left upper arm with significantly enhancement, and the demarcation between the lesion and surrounding soft tissue is clear, closely adjacent to the BA (white arrow). (B–D) MRI demonstrates the lesion is moderate intensity but significantly enhanced on T1-weighted imaging and has high intensity in T2 fat suppressed sequence (white arrows).

