FIGURE 3.
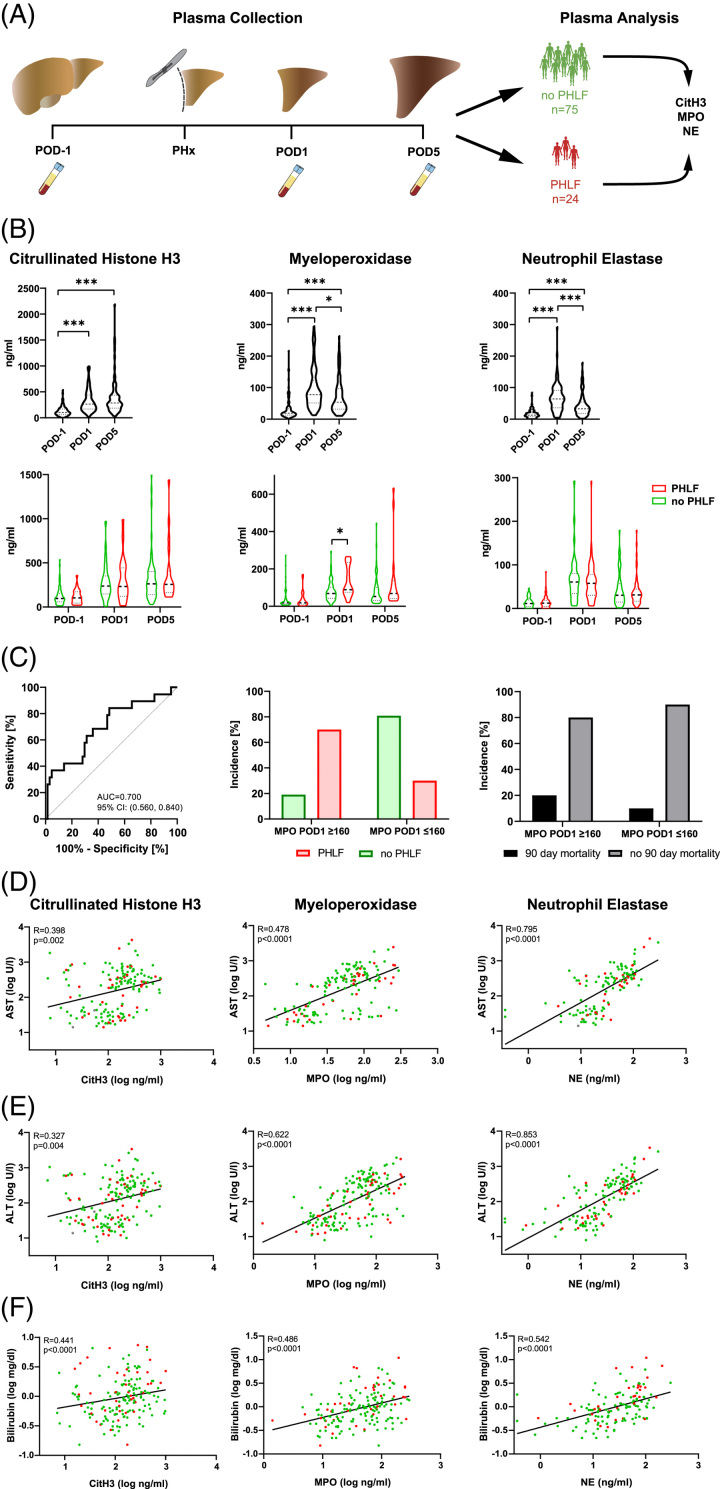
Plasma levels of CitH3, MPO, and NE are regulated in liver regeneration. (A) Experimental scheme. Plasma was collected 1 day before (POD−1), 1 (POD1) and 5 days after (POD5) PHx from 75 patients without PHLF and 24 patients with PHLF. (B) Upper panel: CitH3, MPO, and NE levels on POD−1, POD1 and POD5 (one-way ANOVA: *p<0.05, ***p<0.001). Lower panel: CitH3, MPO, and NE levels in patients with vs. without PHLF (two-way ANOVA: *p<0.05). (C) ROC curve comparing the predictive potential of MPO POD1 with the prevalence of PHLF (left panel); incidence [%] of PHLF (middle panel) and 90-day mortality (right panel) in high-risk patient groups (defined by a cutoff of MPO POD1 levels of above 160 ng/mL). (D–F) Correlation of plasma CitH3, MPO, and NE POD1 with AST, ALT, and bilirubin POD1 plasma levels. Abbreviations: ALT, alanine-aminotransferase; AST, aspartate aminotransferase; CitH3, citrullinated histone H3; MPO, myeloperoxidase; NE, neutrophil elastase; PHLF, post hepatectomy liver failure; PHx, partial hepatectomy; ROC, receiver operating characteristic.

