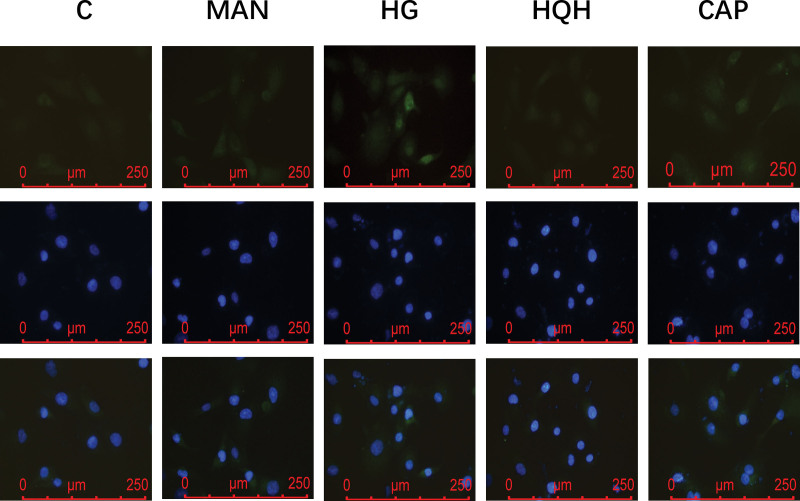
Figure 13.
The fluorescence intensity (green) indicated the expression level of P65 in HK-2 of the C, MAN, HG, HG + HQH and CAP groups by immunofluorescence. Green and blue fluorescence represent P65 and the cell nucleus, respectively. CAP = Captopril, HG = high glucose, HK-2 = human proximal tubular epithelial cells, HQH = Huaiqihuang, MAN = mannitol.

