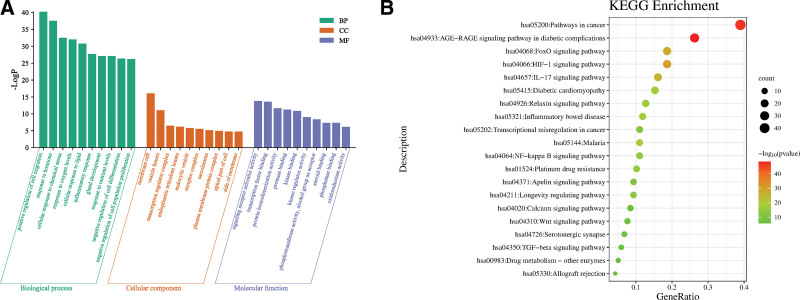
Figure 6.
GO and KEGG enrichment graphs. (A) Green represents BP, orange represents CC, blue represents MF, and the height of the bar represents the number of enrichment; (B) the size of the bubble represents the number of gene enrichment, the larger the bubble, the more the number of genes; the darker the color, the smaller the P value, the greater the significance of enrichment. BP = biological processes, CC = cellular components, GO = gene ontology, KEGG = Kyoto encyclopedia of genes and genomes, MF = molecular functions.

