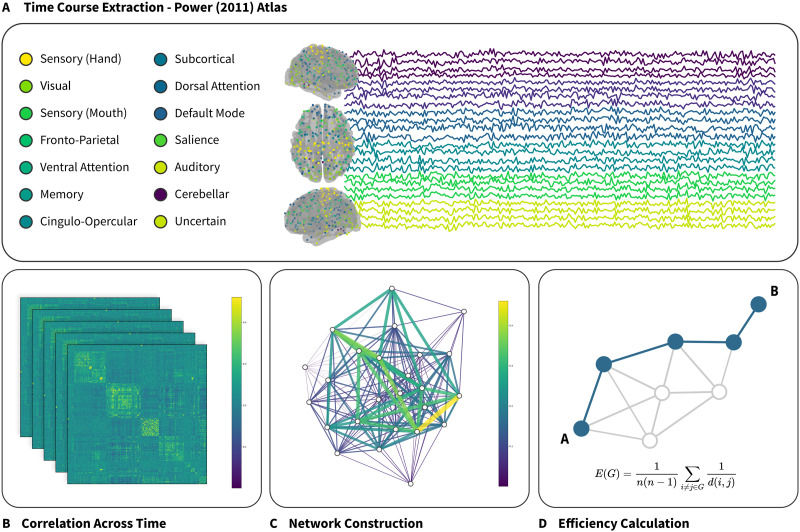
Figure 3. .
Conceptual depiction of brain network extraction and analysis. (A) Time series data is averaged within a 5-mm sphere surrounding each of 264 regions of interest (ROIs) as defined in the Power et al. (2011) atlas. This atlas is divided into 14 subnetworks as defined by task-based functional connectivity. (B) Pairwise correlation is calculated between each of the 264 ROIs, resulting in a 264 × 264 correlation matrix. (C) Edge weights in the network are assigned as the Pearson’s R value between each node. (D) Network efficiency is calculated as the inverse of the mean of all pairwise shortest paths.

