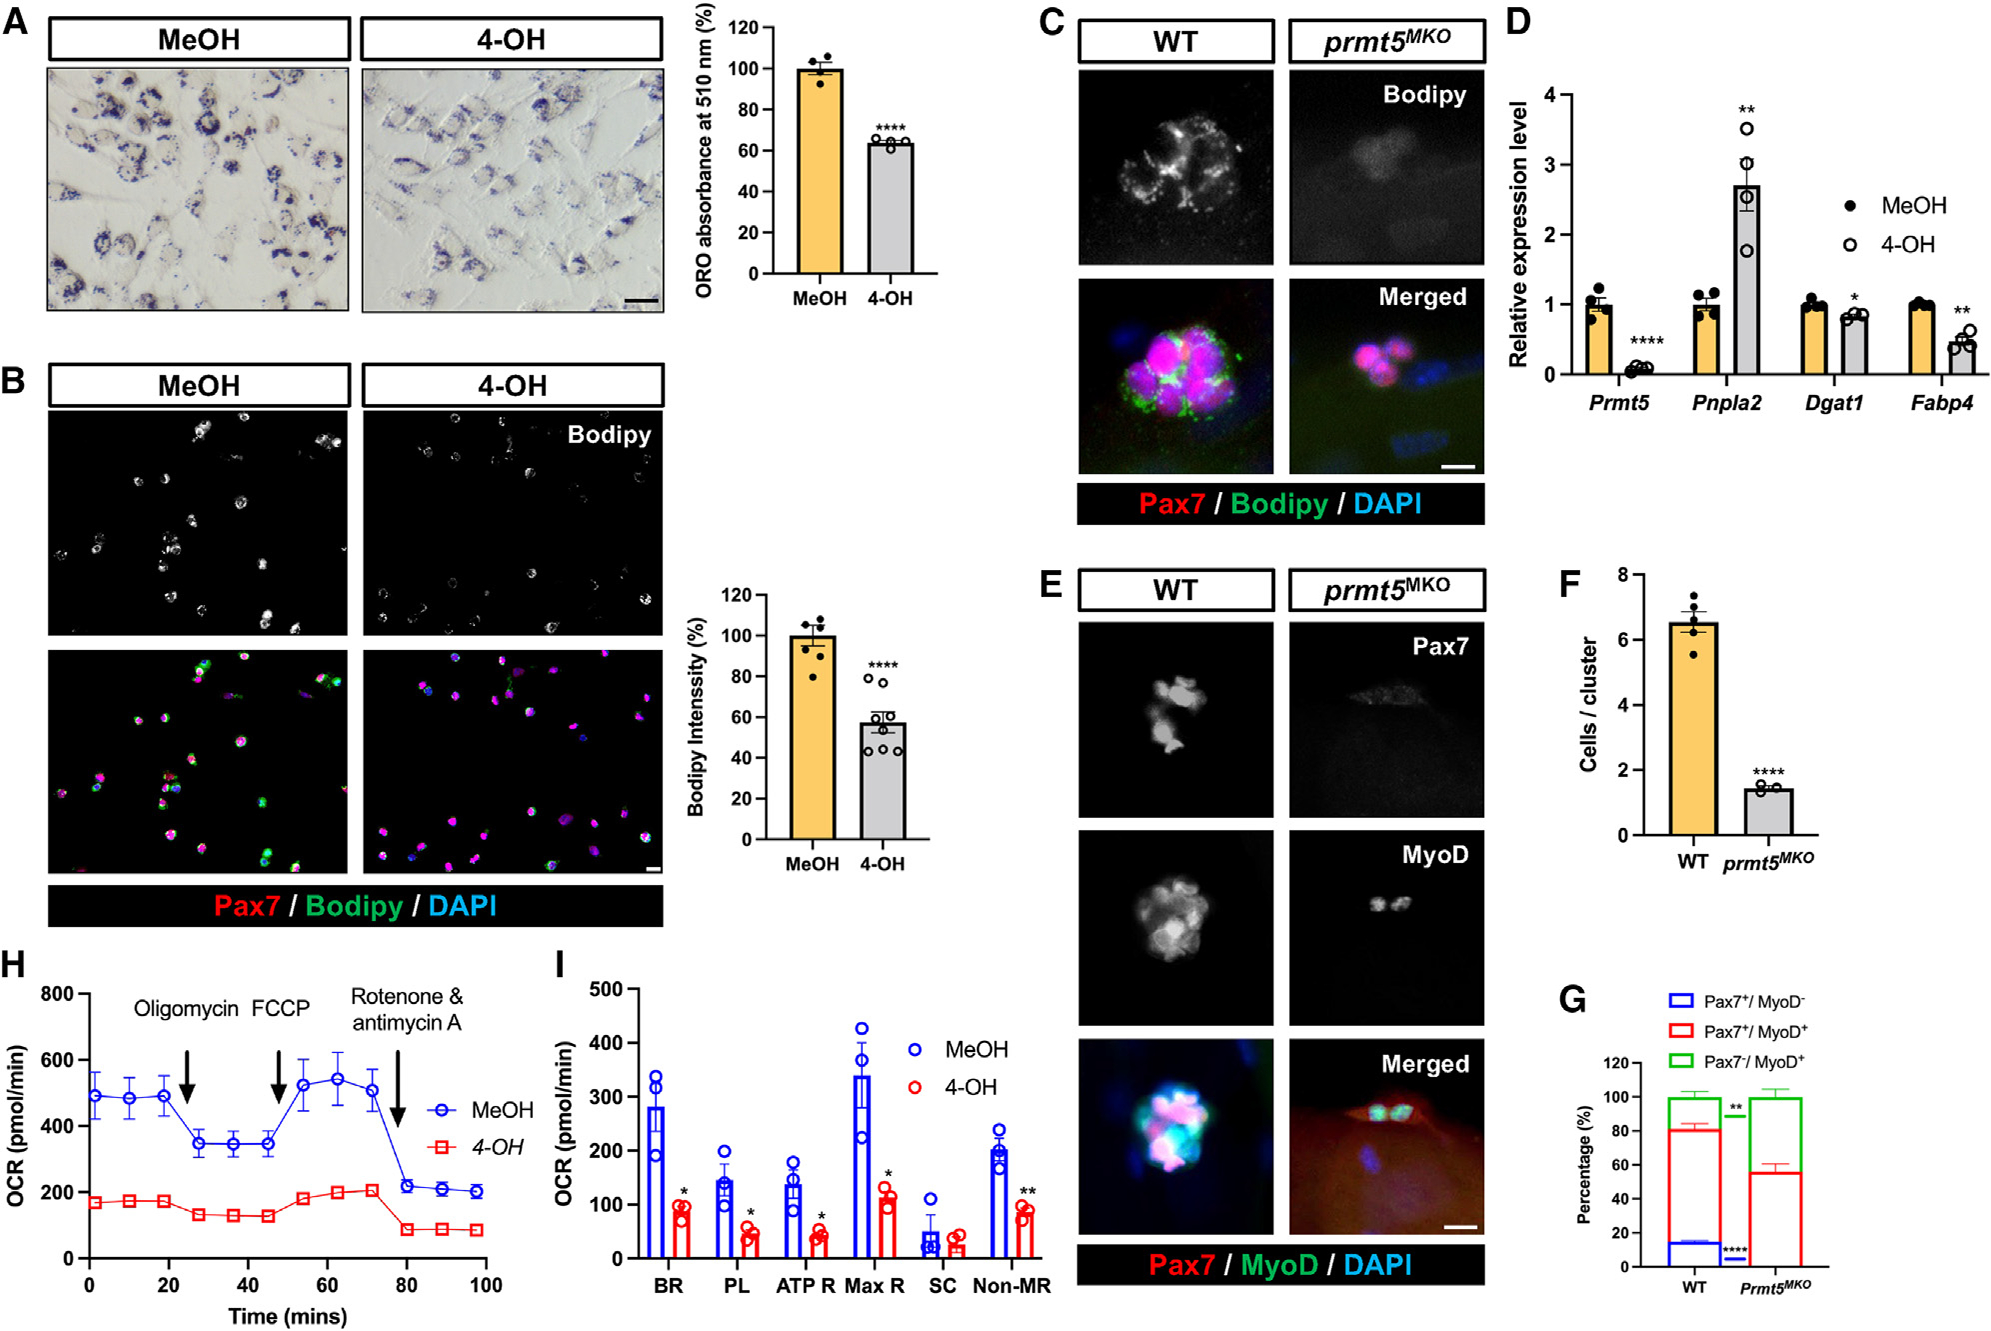
Figure 4. Prmt5 KO diminishes LD abundance and oxidative respiration of SCs, disrupting their cell fate homeostasis.

(A) Oil red O staining (left) and quantification (right) of LD content in control (MeOH) and Prmt5 KO (4-OH) myoblasts. Scale bar, 50 μm.
(B) Pax7 and Bodipy immunofluorescence (left) and quantification of Bodipy intensity (right) in control (MeOH) and Prmt5 KO (4-OH) myoblasts. Scale bar, 10 mm.
(C) Pax7 and Bodipy immunofluorescence (left) and quantification of Bodipy intensity (right) in SCs after proliferating for 72 h on cultured single myofibers isolated from WT and Prmt5MKO mice. Scale bar, 10 μm.
(D) qPCR analysis of lipogenic marker (Pnpla2) and adipogenesis markers (Dgat1, Fabp4) in control (MeOH) and Prmt5 KO (4-OH) myoblasts (n = 4).
(E–G) Pax7 and MyoD fluorescence to distinguish cell fate status in WT and Prmt5MKO SCs (E), quantification of SCs per cluster (F), and proportions of self-renewing (Pax7+MyoD−), proliferating (Pax7+MyoD+), and differentiating (Pax7−MyoD+) cells (G) after culturing on single myofibers for 72 h (n = 3). Scale bar, 10 μm.
(H) Seahorse measurement of oxygen consumption rate (OCR) in control (MeOH) and Prmt5 KO (4-OH) myoblasts in response to sequential addition of oligomycin, carbonyl cyanide-p-trifluoromethoxyphenylhydrazone (FCCP), and rotenone/antimycin A (n = 3).
(I) Average OCR for basal respiration (BR), proton leak (PL), ATP respiration (ATP R), maximal respiration (Max R), spare capacity, and non-mitochondrial respiration (NR) based on H (n = 3). SC, spare capacity.
Values are expressed as mean ± SEM. *p < 0.05, **p < 0.01, ****p < 0.0001 by t test. See also Figure S4.
