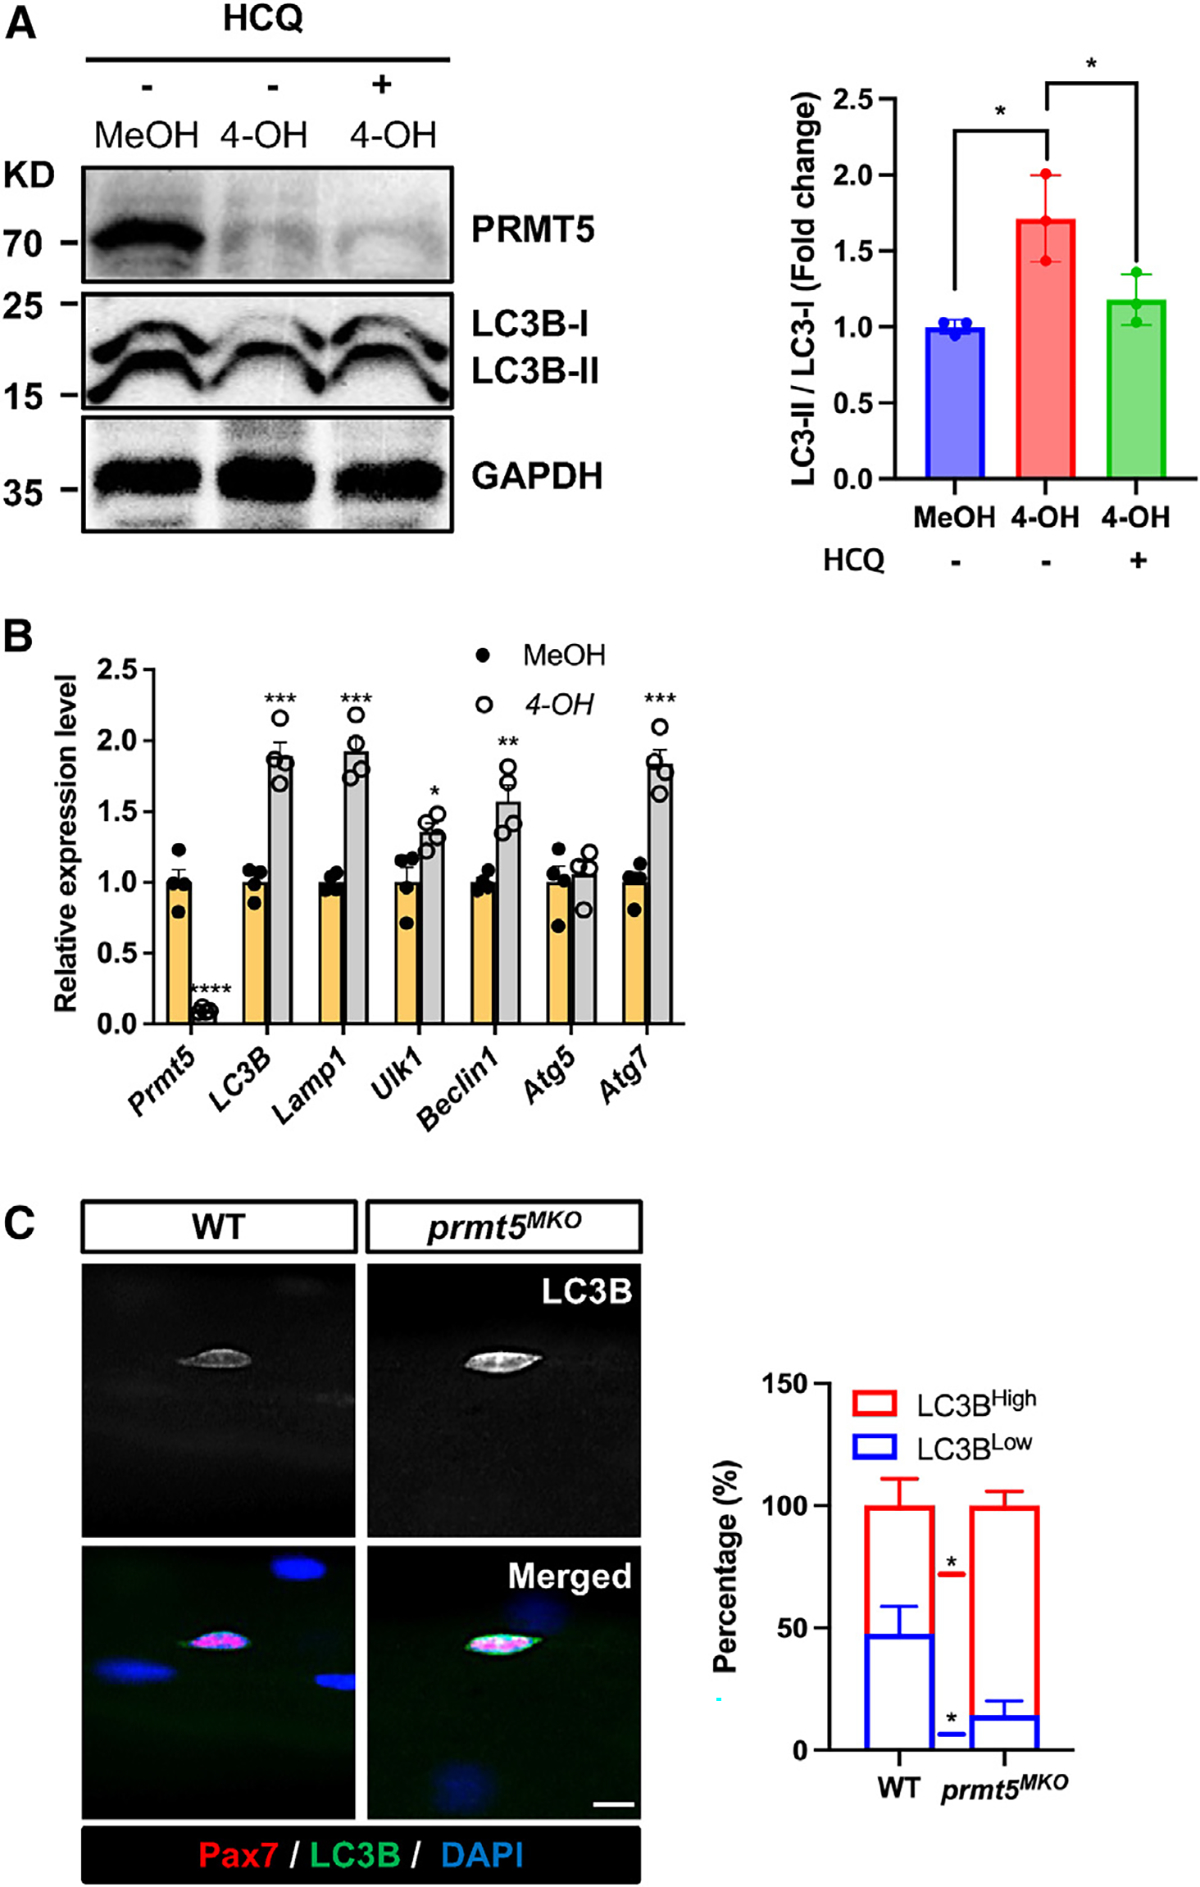
Figure 5. Prmt5 KO activates autophagy in satellite cells.

(A) Western blotting showing levels of PRMT5, LC3B, and GAPDH in control (MeOH) and Prmt5 KO (4-OH) myoblasts in the absence or presence of hydroxychloroquine (HCQ), along with quantified levels (normalized to GAPDH) of LC-II/I, as an indicator of autophagy (right). KD, kilodalton size marker.
(B) qPCR analysis of autophagy makers in control (MeOH) and Prmt5 KO (4-OH) myoblasts (n = 4).
(C) Pax7 and LC3B immunofluorescence (left) and the relative intensity of LC3B (right) in Pax7+ cells grown on freshly isolated single myofibers from WT and Prmt5MKO mice (n = 4). Scale bar, 10 μm.
Values are expressed as mean ± SEM. *p < 0.05, **p < 0.01, ***p < 0.001, ****p < 0.0001 by t test. See also Figure S5.
