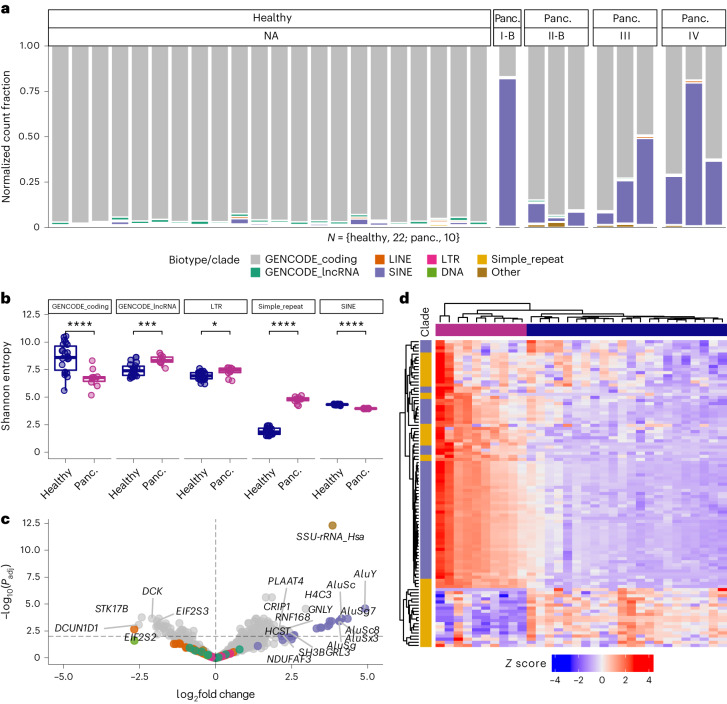
Fig. 2. Disease-specific enrichment of repeat-derived cell-free RNA.
a, Distribution of biotype representation (by DESeq2-normalized count) in cell-free RNA-seq quantifications for samples from each cohort, coloured by GENCODE biotype or repeat subfamily, and facetted by stage (NA for healthy samples). b, Comparison of significantly different (Wilcoxon, two-sided) Shannon entropy distributions for GENCODE biotype (****P = 9.6 × 10⁻⁵, ***P = 0.00019) and repeat subfamilies (*P = 0.014, ****P = 3.1 × 10⁻⁸). c, Volcano plot of significantly (P < 0.01) differentially expressed genes or repeat subfamilies derived from repeat-aware quantification, with horizontal and vertical lines drawn at −log10(0.01) and 0, respectively. d, Heat map (K means) of Z scores calculated from DESeq2-normalized counts of SINEs and simple repeats, with an average of at least five counts per sample across the dataset. For the box plots, the centre line represents the median, the box limits are upper and lower quartiles and whiskers represent 1.5× interquartile range. NA, not applicable.

