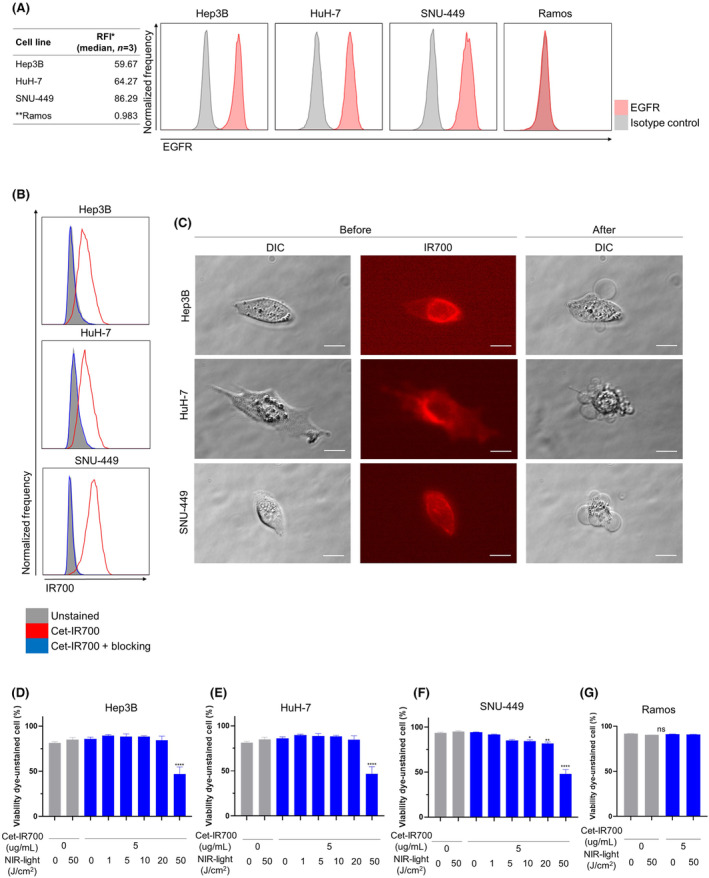
FIGURE 1.

In vitro near‐infrared photoimmunotherapy (NIR‐PIT) using cetuximab‐IR700 (Cet‐IR700) in Hep3B, HuH‐7, and SNU‐449 cells. (A) Flow cytometric analysis of in vitro EGFR expression on Hep3B, HuH‐7, SNU‐449, and Ramos cells. RFI, relative fluorescence intensity. (B) Detection of Cet‐IR700 bound to Hep3B, HuH‐7, and SNU‐449 cells by flow cytometric analysis. (C) Microscopic observation of cancer cells before and after in vitro NIR‐PIT using Cet‐IR700 (images, ×400; scale bar, 20 μm). DIC, differential interference contrast. (D–G) Membrane damage of Hep3B (D), HuH‐7 (E), SNU‐449 (F), and Ramos (G) cells induced by in vitro NIR‐PIT using Cet‐IR700 was measured with Fixable Viability Dye (n = 4; one‐way ANOVA followed by Tukey's test). *p < 0.05. **p < 0.01. ****p < 0.0001. ns, not significant versus untreated control.
