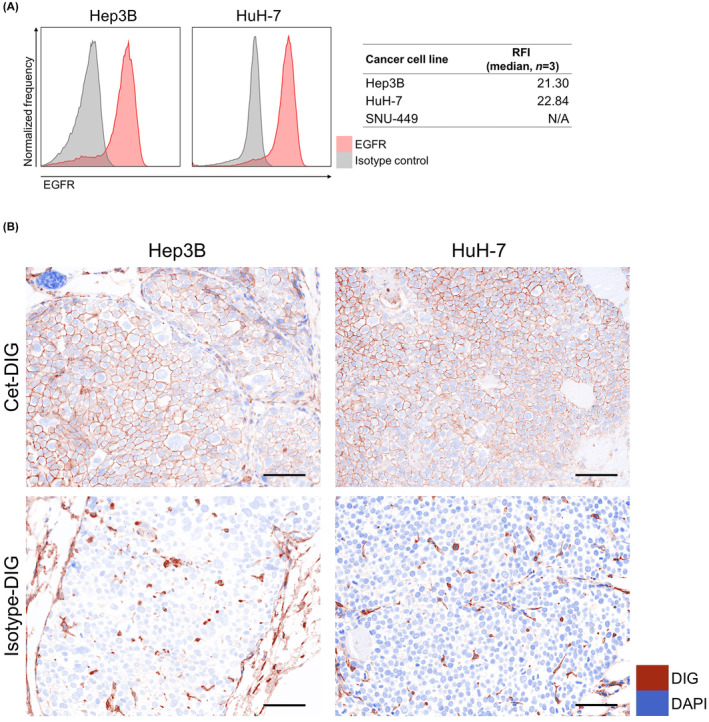
FIGURE 2.

Expression of EGFR in cancer cells and delivery of cetuximab to Hep3B and HuH‐7 cells in vivo. (A) Flow cytometric analysis of in vivo EGFR expression on Hep3B, HuH‐7, and SNU‐449 tumors (n = 3). RFI, relative fluorescence intensity. N/A, not applicable. (B) Tumors were harvested 24 h after injecting Cet‐DIG or isotype‐DIG into mice, and its distribution in Hep3B and HuH‐7 was examined by multiplex immunohistochemistry (images, ×200; scale bar, 100 μm). DAPI expression and DIG are shown in blue and brown, respectively. Cet‐DIG, digoxigenin (DIG)‐conjugated cetuximab.
