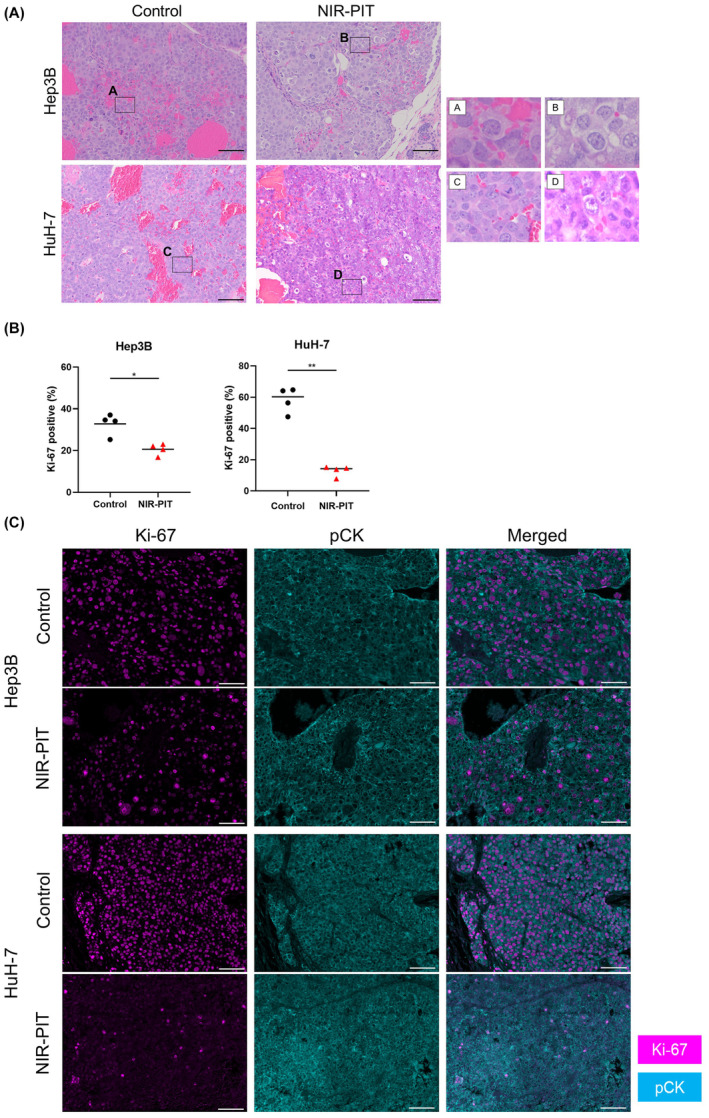
FIGURE 4.

Histological changes after in vivo near‐infrared photoimmunotherapy (NIR‐PIT) using cetuximab‐IR700. Tumor tissue histology was examined 24 h after NIR‐PIT. (A) H&E staining of Hep3B and HuH‐7 tumors after NIR‐PIT (images, ×200; scale bar, 100 μm). Insets (A–D) are enlarged and displayed in the right panels. (B, C) Evaluation of Ki‐67 positivity among cancer cells in Hep3B and HuH‐7 tumors by multiplex immunohistochemistry. (B) Comparison of the percentage of Ki‐67‐positive cancer cells among two groups (n = 4; the Mann Whitney U test). *p < 0.05; **p < 0.01. (C) Representative pictures of Ki‐67 and pCK expression (images, ×200; scale bar, 100 μm). Ki‐67 and pCK expression is shown in magenta and cyan, respectively. pCK, pan‐cytokeratin.
