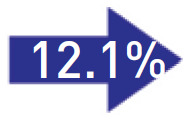
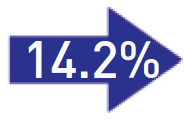
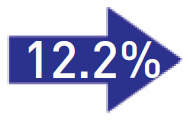
Table 1. Comparison of Modified Koval Index of All Patients Pre & Post Pandemic, Nursing Hospital and Home Care, and Comparison of Exacerbation Rate during Pre & Post Pandemic.
| All patient | Nursing hospital | Home care care | ||||||||
|---|---|---|---|---|---|---|---|---|---|---|
| Pre-Group A (n=81) | Pan-Group B (n=103) | Pre-Group A(n=46) | Pan-Group B (n=54) | Pre-Group A (n=35) | Pan-Group B (n=49) | |||||
| Before fracture | 4.23±1.13 | 4.04±1.28 | 3.87±1.22 | 3.67±1.39 | 4.71±0.79 | 4.45±1.00 | ||||
| P-value | 0.28 | 0.44 | 0.20 | |||||||
| After fracture | 3.31±1.79 | 2.77±1.91 | 2.74±1.76 | 1.93±1.81 | 4.06±1.57 | 3.69±1.57 | ||||
| P-value | 0.04* | 0.03* | 0.30 | |||||||
| Exacerbation | 35 (43.2%) |

|
57 (55.3%) | 25 (54.3%) |

|
37 (68.5%) | 10 (28.6%) |

|
20 (40.8%) | |
Values are presented as mean±standard deviation.
Group A: patients who underwent surgical treatments from January 2018 to December 2019, Group B: patients who underwent surgical treatments from January 2020 to December 2021 after the outbreak of the COVID-19 pandemic. Pre-: pre-pandemic, Pan-: pandemic.
*P<0.05; by independent t-test.
