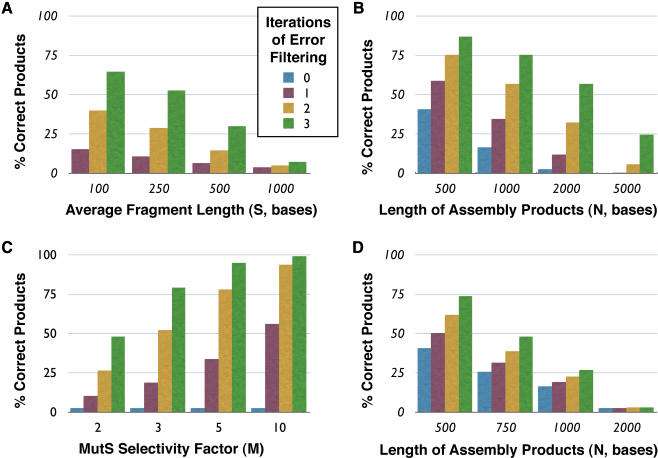
Figure 5.
Mathematical modeling of consensus shuffling and coincidence filtering. Predictions from theoretical model of consensus shuffling calculated with the following parameters (unless otherwise specified): error rate of input population per base, E = 0.0018; length of product assembled, N = 2000; MutS selectivity factor, M = 2.2; average fragment size, S = 200. (A) Errors versus average digested fragment length for consensus shuffling. (B) Errors versus product length for consensus shuffling. (C) Errors versus MutS selectivity factor for consensus shuffling. (D) Errors versus product length for coincidence filtering (N = S).

