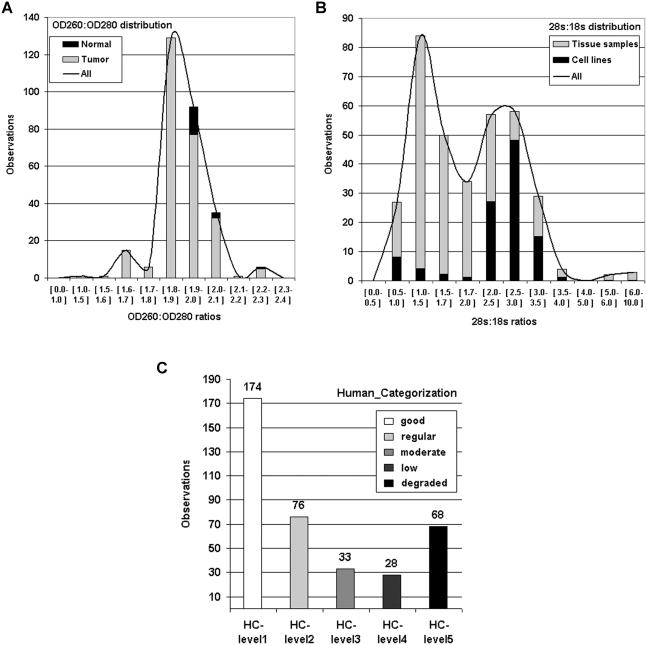
Figure 2.
Conventional RNA integrity definition. (A and B) A260:A280 and 28S:18S ratio distributions were checked for 399 RNA sample profiles. Predefined classes and number of observations are, respectively, indicated in the x- and y-axes. Lines refer to mean distribution. (A) The A260:A280 ratio distribution from normal (in black) and cancerous (in gray) sample types is shown. (B) rRNA area ratios were successfully computed from 348 RNA sample profiles by the Agilent biosizing software based on a routine baseline detection and definition of ribosomals peak areas. Distribution of cell lines (in black) and tissue type (in gray) samples is shown. (C) Human categorization was done from Agilent electropherograms by trained operators who indexed 379 RNA sample profiles into 5 discrete classes (Human Categorization-level, HC-level). The distribution is represented by the number of records in each class. The remaining 20 samples could not be allocated.

