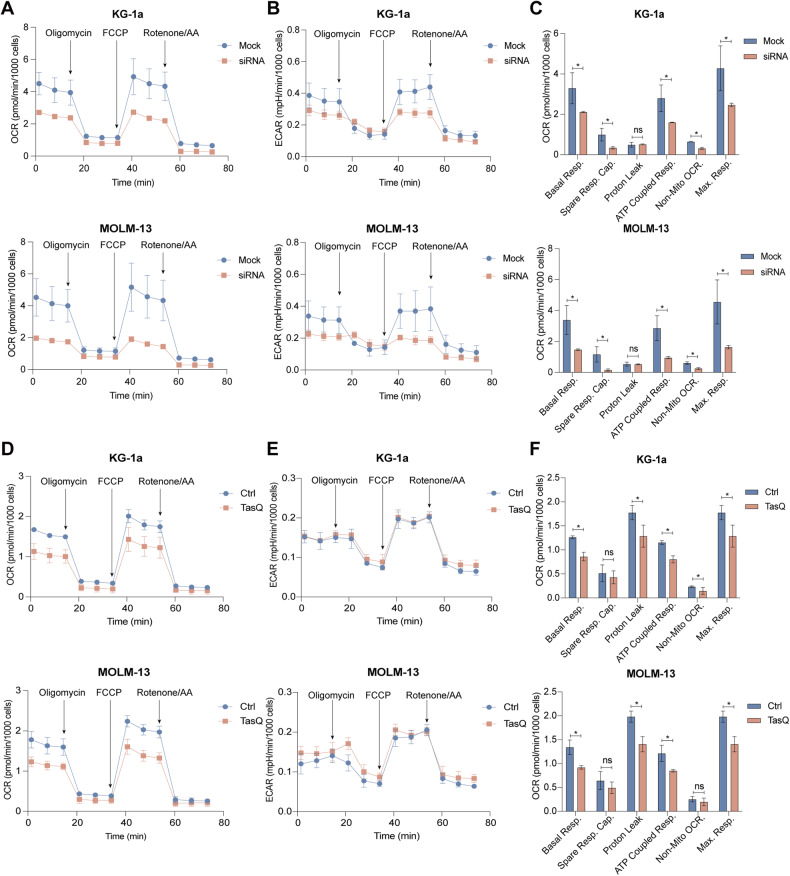
Fig. 4. Seahorse analysis of cellular metabolic fluxes after siRNA-mediated knockdown or tasquinimod treatment in AML cells.
Mitochondrial bioenergetics was analyzed using the Agilent XF Seahorse technology. KG-1a and MOLM-13 cells were treated with 20 nm S100A9-siRNA or tasquinimod (25 μM) for 48 h (n = 3). A OCR assessment of siRNA-transfected KG-1a (up) and MOLM-13 (down) cells. B ECAR assessment of siRNA-transfected KG-1a (up) and MOLM-13 (down) cells. C MitoStress test parameters of siRNA-transfected KG-1a and MOLM-13 cell lines. D OCR assessment of tasquinimod-treated KG-1a (up) and MOLM-13 (down) cells. E ECAR assessment of tasquinimod-treated KG-1a (up) and MOLM-13 (down) cells. F MitoStress test parameters of tasquinimod-treated KG-1a and MOLM-13 cell lines. *p < 0.05, **p < 0.01, ***p < 0.001, Mann–Whitney U-test, Error bars indicate SD.

