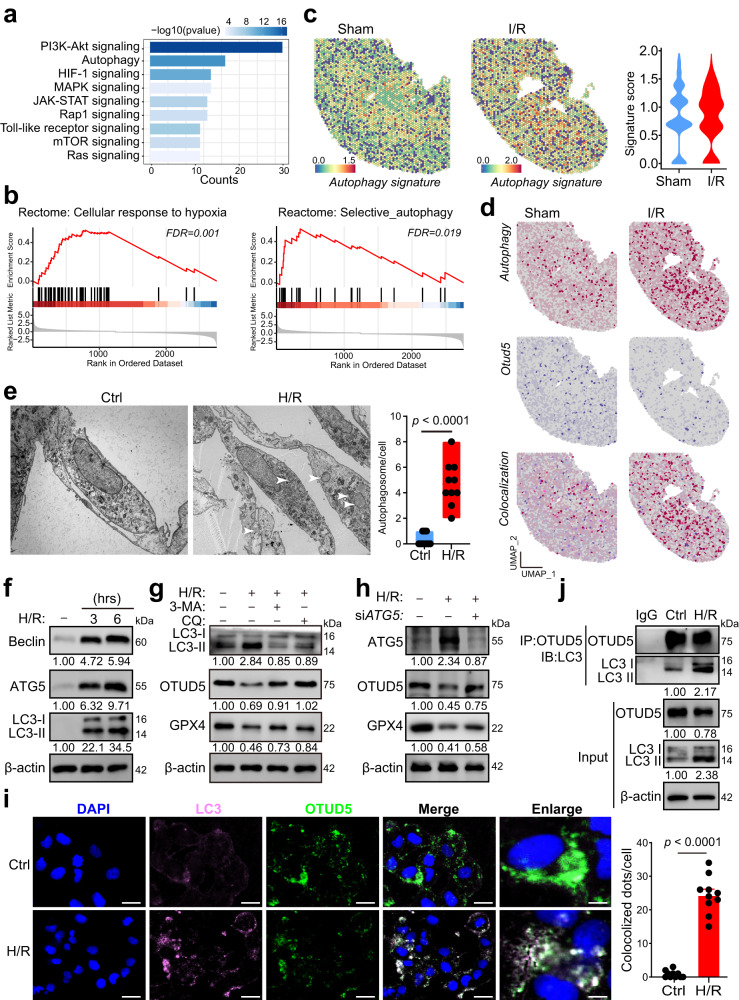
Fig. 5. Hypoxia activates autophagy degradation of OTUD5.
a PRTCs were treated with H/R for 3 h, followed by RNA isolation and sequencing. A bar plot shows autophagy-associated signaling pathways among the enriched signaling pathways using KEGG analysis. Statistical significance between groups, as indicated, was determined using Fisher’s exact test. b GSEA analysis shows that the Reactome signaling terms: selective autophagy and cellular response to hypoxia were significantly enriched based on the scRNA-seq data of PT cells from I/R-treated kidneys and sham kidneys. c Spatial feature plot and Violin plot of autophagy signature score in ST spots of the two groups. d Feature plot of Otud5 expression, autophagy signature, and their colocalization in ST spots of the two groups. e PRTCs were treated with H/R for 3 h and observed for autophagosome formation using a transmission electron microscope (TEM). The representative TEM images and quantification of autophagosomes (white arrowhead) are displayed (n = 10 independent cells). p values were calculated by unpaired two-tailed Student’s t-test. f PRTCs were treated with H/R for 3 or 6 h, and cells were collected and analyzed by immunoblotting. g PRTCs were treated with H/R for 3 h in the presence or absence of the proteasome inhibitor 3-MA, or the lysosome inhibitor chloroquine (CQ). Cells were collected and analyzed by immunoblotting. h PRTCs were transfected with siControl or siATG5 for 48 h and treated with or without H/R. Cells were collected and analyzed by immunoblotting. i Representative fluorescence images of LC3 and OTUD5 in HK2 cells treated with or without H/R (n = 10 independent cells). Scale bar = 50 or 10 μm. j Cells were treated with H/R for 3 h and collected to analyze the interaction of LC3 and OTUD5 using immunoprecipitation (IP). Data are from three independent experiments and presented as mean ± s.e.m., statistical significance between groups as indicated was determined using an unpaired two-tailed Student’s t-test.

