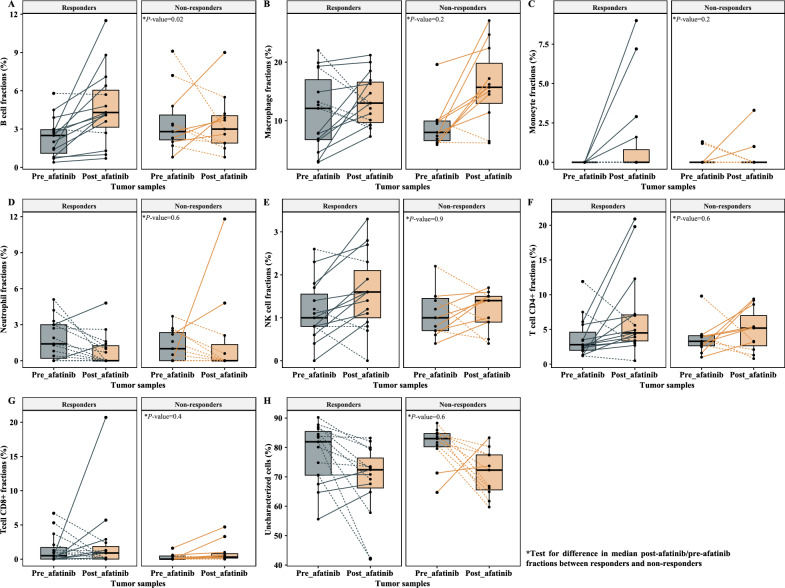
Figure 3.
Tumor microenvironment cell fraction changes between pre- and post-afatinib tumor biopsies in responder (N = 14) and non-responder patients (N = 11) according to the metabolic response on FDG-PET scan by PERCIST. Tumor microenvironment cells included B cells (A), macrophages (B), monocytes (C), neutrophils (D), NK cells (E), T cells CD4+ (F) and T cells CD8+ (G). Uncharacterized cells, which were representative of cells outside immune subtypes (including tumor cells), were also reported (H).

