
Fig. 6. Whole transcriptome analysis of adult male prefrontal cortices in B. fragilis treated mice.
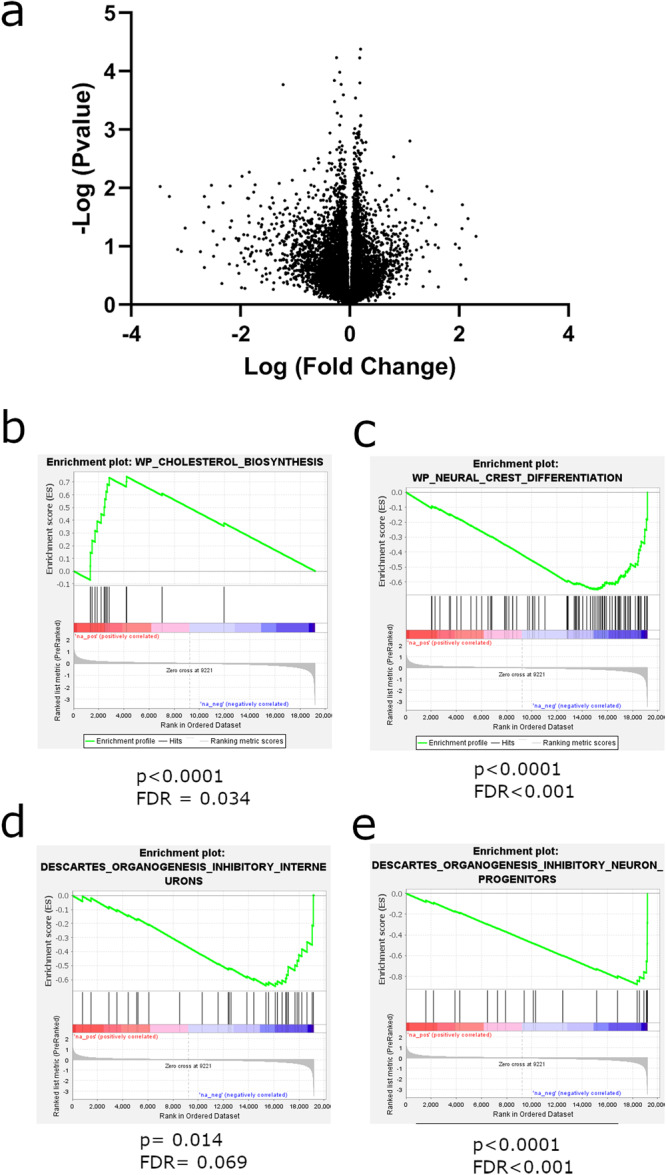
a Volcano plot of genes in differential expression analysis between B. fragilis treated and untreated mice. X axis is log fold change of genes between treatment groups and Y axis is negative log p value of each gene. b–e GSEA analysis describing enriched gene categories among upregulated or downregulated genes. b Enrichment of cholesterol biosynthesis genes in B. fragilis-treated group and c a decrease of genes related to neural crest differentiation in the same treatment group. d A decrease in genes expressed specifically in inhibitory interneurons in the B. fragilis-treated group together with a decrease in e inhibitory interneuron progenitor genes in the same group.