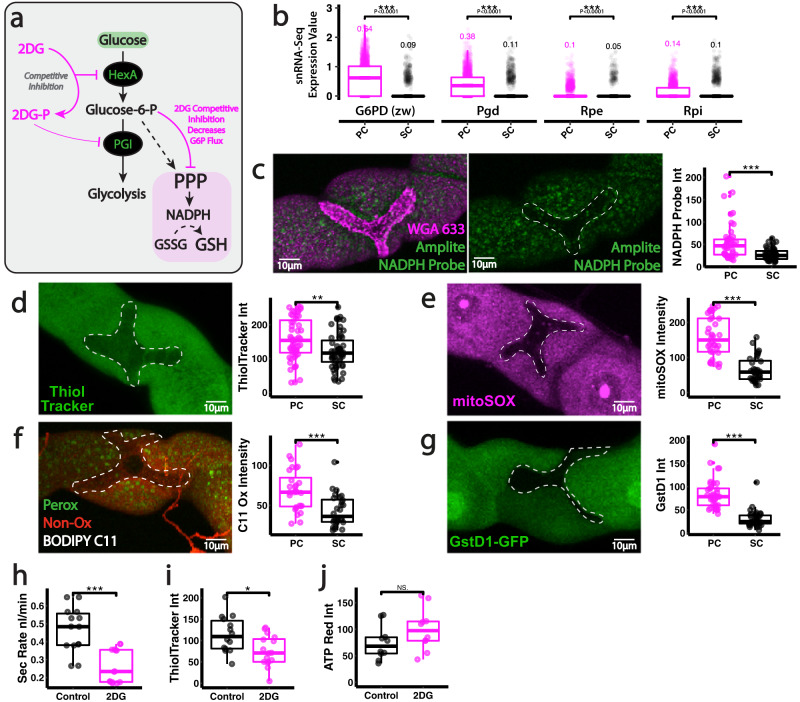
Fig. 4. Sustained PPP activity within renal PCs supports organ-wide function.
a Schematic of early glucose metabolism and mechanism of inhibition. b Expression of key PPP components in PCs and SCs from publicly available Fly Cell Atlas snRNA-Seq data. Analysis and quantification of Amplite NADPH probe staining (c), Thioltracker (GSH) (d), mitoSox (e), BODIPY C11 (f) and GstD1-GFP (g) in renal tubule SCs and PCs. Secretion rate (h), bioenergetic output (ATP Red, i) and Thioltracker (GSH, j) staining in 2DG treated renal tubules. Data represented as box and whisker plots (lower and upper hinges correspond to the first and third quartiles, median line within the box, whiskers extend from the hinge to the largest/smallest value, at most 1.5* interquartile range of the hinge) with all data from MpT cells (SCs or PCs, b–g), MpT main segment sections (i, j) or secretion of individual kidneys (g) shown as overlaid points. NS Not Significant, *P < 0.05, **P < 0.01, ***P < 0.001 (unpaired two-tailed t-tests or Wilcoxon test with FDR correction). p values: (c) p < 0.0001, (d) p = 0.00258, (e) p < 0.0001, (f) p = 0.000117, (g) p < 0.0001, (h) p < 0.0001,(i) p = 0.0119. p values for (b) displayed on the Figure. For analysis of fluorescent reporters/dyes, two images of different sections of the MpT main segment per fly were imaged. All images representative of >9 tubules. All images are maximum z projections. c n = 46 cells (from 11 tubules) per condition, (d) n = 55 cells (from 7 tubules) per condition, (e) n = 36 cells (from 6 tubules) per condition, (f) n = 28 cells (from 7 tubules) per condition, (g) n = 35/36 cells (from 6 tubules) per condition, (h) n = 14 tubules per condition, (I) n = 14 control and 16 2DG tubules,(j) n = 10 tubules per condition. Source data are provided as a Source Data file.

