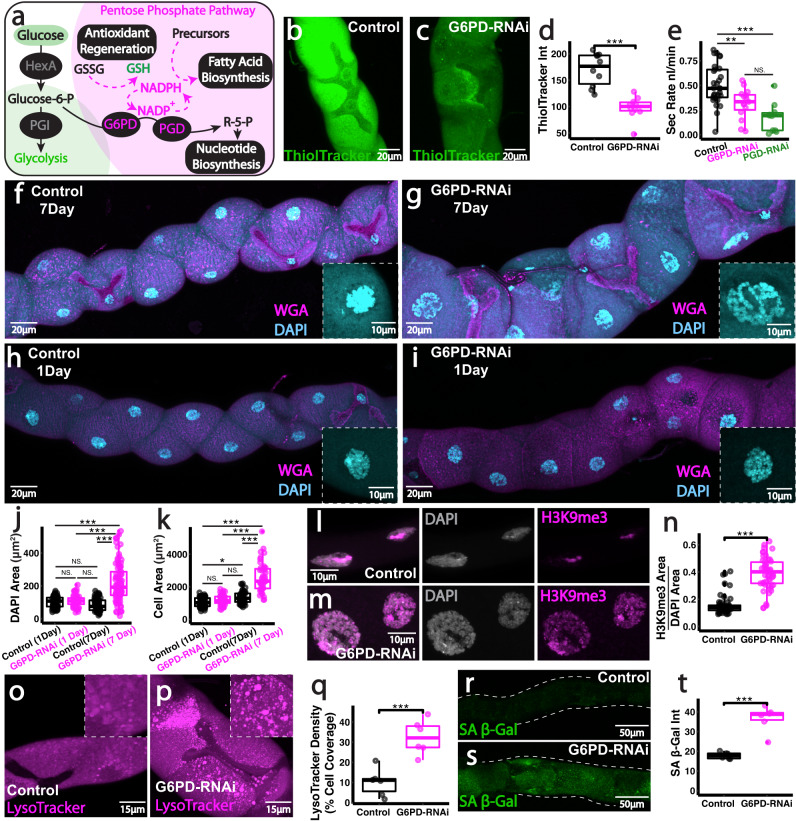
Fig. 5. PPP activity primes PC antioxidant defences and limits premature renal aging.
a Schematic of the key roles of the pentose phosphate pathway. Analysis and quantification of Thioltracker (GSH, b–d) and secretory activity (e) in G6PD-RNAi and PDG-RNAi tubules (driven by CapaR-Gal4). f, g WGA and DAPI staining in G6PD-RNAi tubules at 7 days and 1 day (h, i) post-eclosure. j, k Quantification of nuclear area (DAPI) and cell area. l–n H3K9me3 and DAPI, Lysotracker o–q and SA β-Gal (r–t) staining and quantification in 7-day G6PD-RNAi tubules. Data represented as box and whisker plots (lower and upper hinges correspond to the first and third quartiles, median line within the box, whiskers extend from the hinge to the largest/smallest value, at most 1.5* interquartile range of the hinge) with all data from MpT main segment sections (d, q, t), nuclei/cells from main segments (j, k, n) or secretion of individual kidneys (e) shown as overlaid points. NS Not Significant, **P < 0.01, ***P < 0.001 (unpaired two-tailed t-tests or ANOVA followed by Tukey multiple comparisons test where appropriate). p values: (d) p < 0.0001, (e) control vs G6PD p = 0.00507, control vs PGD p < 0.0001, (j) 1 day control vs 7 day G6PD p < 0.0001, 1 day G6PD vs 7 day G6PD p < 0.0001, 7 day control vs 7 day G6PD p < 0.0001, (k) 1 day control vs 7 day control p = 0.00514, 1 day control vs 7 day G6PD p < 0.0001, 7 day G6PD vs 1 day G6PD p < 0.0001, 7 day G6PD vs 7 day control p < 0.0001, (n) p < 0.0001, (q) p = 0.000567, (t) p = 0.000574. p values where p > 0.05 labelled as NS. For analysis of fluorescent reporters/dyes, two images of different sections of the MpT main segment per fly were imaged. All images representative of >5 tubules. All images are maximum z projections. d n = 10 tubules per condition, (e) n = 29 control, 15 G6PD and 10 PGD tubules, (j) 73 nuclei (from 6 control 1 day tubules), 66 nuclei (from 4 G6PD 1 day tubules), 68 nuclei (from 5 control 7 day tubules) and 97 nuclei (from 9 G6PD 7 day tubules), (k) 70 cells (from 6 control 1 day tubules), 61 cells (from 4 G6PD 1 day tubules), 50 cells (from 5 control 7 day tubules) and 45 cells (from 9 G6PD 7 day tubules), (n) n = 56/50 nuclei (from 4 tubules) per condition, (q) n = 6 tubules per condition, (t) n = 6 tubules per condition. Source data are provided as a Source Data file.

