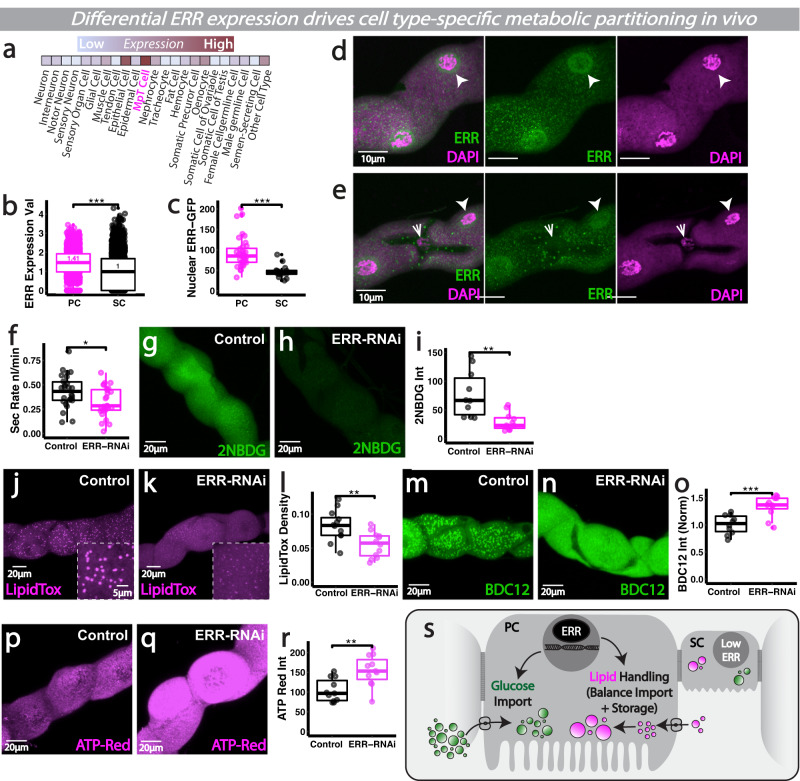
Fig. 6. Differential ERR activity may couple cellular identity to metabolism within intact heterogenous renal tissues.
a Fly Cell Atlas scRNA-seq expression of ERR. b Cell-type specific snRNA-seq expression of ERR from publicly available Fly Cell Atlas snRNA-seq data. c–e ERR-GFP and DAPI analysis and quantification in renal SC and PC nuclei. f Secretory activity in CapaR>ERR-RNAi tubules. g–i Analysis and quantification of 2-NBDG, Lipidtox (j–l), BODIPY C12 (m–o) and ATP-Red (p–r) in ERR-RNAi tubules. s Schematic of ERR metabolic programming. Data represented as box and whisker plots (lower and upper hinges correspond to the first and third quartiles, median line within the box, whiskers extend from the hinge to the largest/smallest value, at most 1.5* interquartile range of the hinge) with all data from MpT main segment sections (i, l, o, r), nuclei from main segments (c) or secretion of individual kidneys (f) shown as overlaid points. NS Not Significant, *P < 0.05, **P < 0.01, ***P < 0.001 (unpaired two-tailed t-tests or Wilcoxon test with FDR correction). p values: (b) p < 0.0001, (c) p < 0.0001, (f) p = 0.0171, (i) p = 0.00446, (l) p = 0.00358, (o) p = 0.000584, (r) p = 0.00285. For analysis of fluorescent reporters/dyes, two images of different sections of the MpT main segment per fly were imaged. All images representative of >9 tubules. All images are maximum z projections. c n = 36/14 nuclei (from 5 tubules), f n = 26 control and 27 RNAi tubules, i n = 10 tubules per condition, l n = 12 tubules per condition, o n = 10/11 tubules per condition, (r) n = 11 tubules per condition. Source data are provided as a Source Data file.

