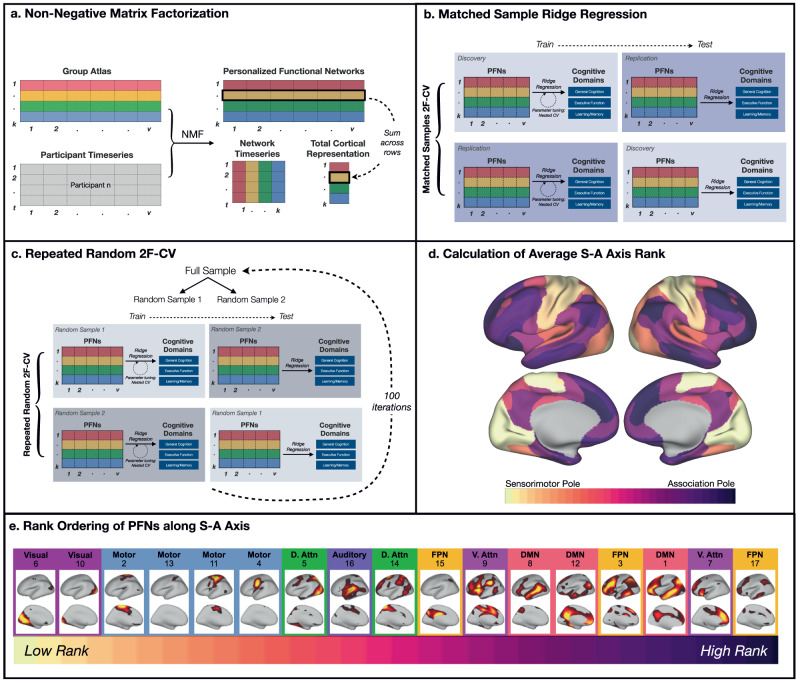
Fig. 1. Identification and analysis of Personalized Functional Networks (PFNs).
a Using a previously-defined group atlas16 as a prior, we generated personalized functional networks (PFNs) by applying non-negative matrix factorization (NMF) to each individual participant’s vertex by time matrix. This procedure allows each network in the consensus group atlas to have a varying cortical representation in each individual, thereby capturing individual differences in the size and layout of networks while simultaneously allowing for interpretable between-individual comparisons. We also calculated the total cortical representation of each PFN by summing each network’s loadings across all vertices. b To evaluate whether an individual’s multivariate pattern of PFN topography could accurately predict cognition in unseen data, we trained linear ridge regression models using the cortical representation of each PFN while controlling for age, sex, site, and head motion. Leveraging our matched discovery and replication samples for two-fold cross-validation (2F-CV), we first trained models in the discovery sample using nested cross-validation for parameter tuning, and then tested these models in the held-out replication sample. We then performed nested training in the replication sample and testing in the held-out discovery sample. c To demonstrate that our results were not dependent on the matched discovery and replication sample split, we conducted repeated random cross-validation over one hundred iterations, each time performing a random split of our full sample and applying two-fold cross-validation. d Next, we calculated the average sensorimotor-association (S-A) axis rank across the vertices contained within each PFN. e We then rank-ordered each PFN according to its average S-A rank. Brain maps depict vertex loadings for each PFN (D. Attn Dorsal Attention, V. Attn Ventral Attention, DMN Default Mode Network, FPN Fronto-Parietal Network).

