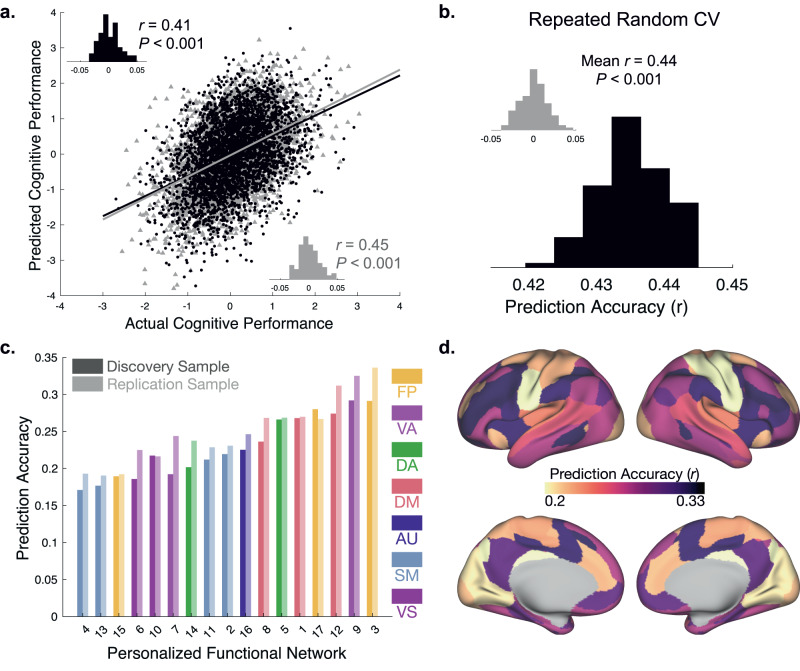
Fig. 2. Functional topography of association networks predicts individual differences in general cognition in unseen data.
a Association between actual and predicted cognitive performance using two-fold cross-validation (2F-CV) with nested cross-validation for parameter tuning across both the discovery (black scatterplot; r(3525) = 0.41, p = 3.050 × 10-146) and replication (gray scatterplot; r(3447) = 0.45, p = 3.850 × 10-174) samples. Inset histograms represent the distributions of prediction accuracies from a permutation test. b Repeated random 2F-CV (100 runs) provided evidence of stable prediction accuracy across splits of the data, which was far better than a null distribution with permuted data (inset). Two-sided t-test reveals that repeated random 2F-CV prediction accuracies are significantly greater than the null distribution of prediction accuracies with permuted data (t(100) = 261.274, p = 2.595 × 10-253). c Prediction accuracy is shown for seventeen models trained on each PFN independently for the discovery sample (dark bars) and replication sample (light bars), with the highest prediction accuracies found in the ventral attention and fronto-parietal control networks. Note that all p-values associated with prediction accuracies are significant after Bonferroni correction for multiple comparisons. (FP Fronto-Parietal, VA Ventral Attention, DA Dorsal Attention, DM Default Mode, AU Auditory, SM Somatomotor, VS Visual). d Functional topography within association networks yield the most accurate predictions of general cognition. Prediction accuracy across the full sample shown for seventeen cross-validated models trained on each PFN independently.

