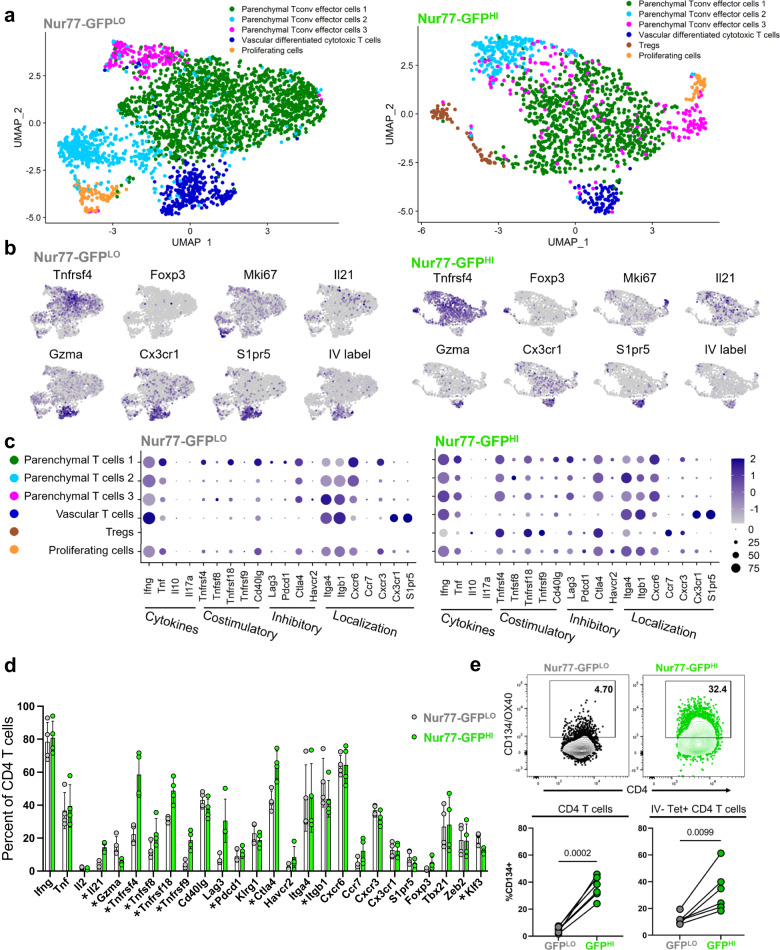
Fig. 3. Nur77-GFPHI and Nur77-GFPLO CD4 T cells differ in expression of effector molecules.
a–d Single-cell RNA-Sequencing of Nur77-GFPLO and Nur77-GFPHI CD4 T cells (2,664 and 1386, respectively) sorted from Nur77-GFP lungs at four weeks post-infection. a Data show paired cells from an individual mouse, representative of 4 biological replicates. Colors indicate transcriptomic clusters with manual annotation based on differential expression of marker genes. b Feature plots show regions of elevated expression of indicated genes in Nur77-GFPLO and Nur77-GFPHI cell populations. For IV label, CD45.2 CITE-seq antibody was injected immediately before harvest. c Dot plots show relative abundance (color scale) and prevalence (circle size) of indicated gene expression in each cluster, in Nur77-GFPLO and Nur77-GFPHI cell populations. Source data for a–c are located in Supplementary Data S3d Columns indicate percent of Nur77-GFPLO and Nur77-GFPHI CD4 T cells expressing each gene, paired from 4 individual mice. Asterisks indicate q value < 0.05 for paired two-tailed t tests adjusted for multiple comparisons, with precise q value listed in Supplementary Data S4. e Flow cytometry of OX40 surface protein expression on Nur77-GFPLO and Nur77-GFPHI CD4 T cells from Nur77-GFP lungs harvested at four weeks post-infection. CD45.2 fluorescent antibody injected immediately before harvest identifies vascular cells. Tetramer+ cells represent either Ag85B or ESAT-6 specificity. Gated on IV- Tetramer+ or bulk live CD4+ CD44+ Nur77-GFPLO or Nur77-GFPHI cells. P values calculated with a paired two-tailed t-test, 5-6 mice per group. Error bars indicate standard deviation.

