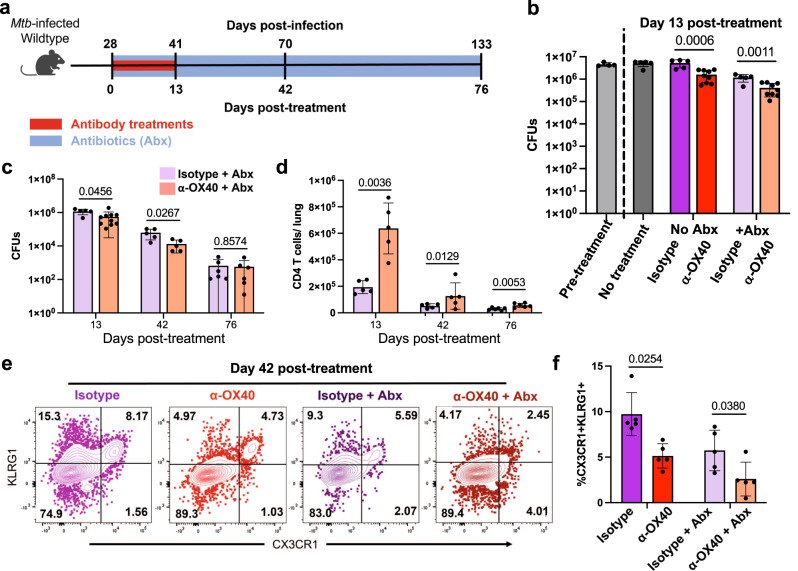
Fig. 7. OX40 agonism improves antibiotic treatment outcomes.
a–f Wildtype C57BL/6 mice at four weeks post-infection treated with 100 μg α-OX40 agonist or isotype control antibody injections twice weekly for two weeks. Antibiotic mice also treated from four weeks post-infection to harvest with isoniazid and rifampin in water continuously. Mice harvested at 0, 13, 42, and 76 days post-treatment for flow cytometry of lung bacterial load. b Lung bacterial load of α-OX40 antibody or isotype control antibody, with or without antibiotics. Pretreatment wildtype lungs harvested at 0 days post-treatment. Data representative of two repeat experiments. Two-way ANOVA results: antibiotic treatment contributed 43% of variance p < 0.0001, antibody treatment contributed 30% of variance p < 0.0001, interaction contributed 13% of variance p = 0.0015; p values shown in figure calculated with two-tailed t testing adjusted for multiple comparisons. Mice per group: 4 for pre-treatment, 5 for no treatment, 5 for no antibiotics + Isotype, 9 for no antibiotics + OX40, 5 for antibiotics + Isotype, 9 for antibiotics + OX40. c, d CFUs and number of CD4 T cells in the lungs of α-OX40 antibody or isotype control antibody treated mice. Gated on live CD4+ CD44+ cells. Cell numbers assessed using counting beads. P values calculated with an unpaired two tailed t-test, adjusted for multiple comparisons. Mice per group: 5 for isotype and 10 for OX40 at day 13, 5 each for isotype and OX40 at day 42, and 6 each for isotype and OX40 at day. e, f Frequency of terminally differentiated CD4 T cells in the lungs of α-OX40 antibody or isotype control antibody, with or without antibiotics. Gated on live CD4+ CD44+ CX3CR1+ KLRG1+ cells. Two-way ANOVA results: antibiotic treatment contributed 39% of variance p = 0.0005, antibody treatment contributed 27% of variance p = 0.0005, interaction contributed 1% of variance p = 0.43; p values shown in figure calculated with two-tailed t testing adjusted for multiple comparisons, 5 mice per group. Error bars indicate standard deviation.

