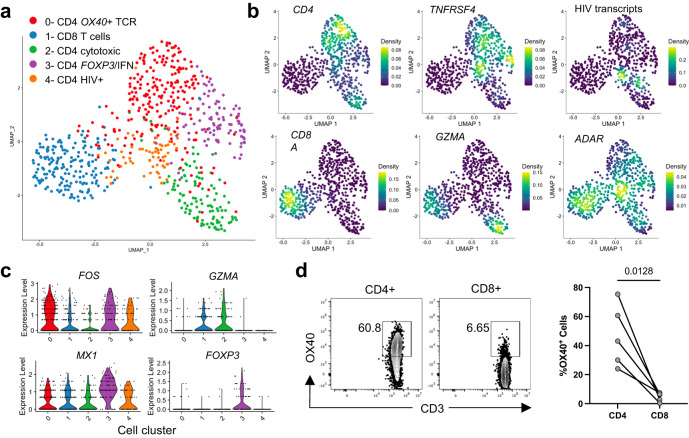
Fig. 8. Human CD4 T cells at the site of HIV-associated TB meningitis express OX40.
a UMAP representing single-cell RNA-Sequencing of CD4+ and CD8+ T cells sorted from cerebrospinal fluid (CSF) cells from a human person with HIV-associated TB meningitis. Sorted cells were gated on live, CD3+, CD4+ and CD8+ cells. Clusters were manually identified according to the differential expression of key genes, indicated as follows. b Plots show the relative density of cells expressing each marker gene. c Violin plots show each gene’s relative expression level by cells assigned to each phenotypic cluster. Source data for a–c are located in Supplementary Data S5. d OX40 surface expression in cells from the CSF of 5 individuals treated for HIV-associated TB meningitis. Flow cytometry dot plots indicate the percentage of CD4+ or CD8+ T cells from a single individual that express OX40, while column dot plots show the paired percentage of CD4 or CD8 T cells from 4 individuals. P value calculated with a paired two-tailed t-test.

