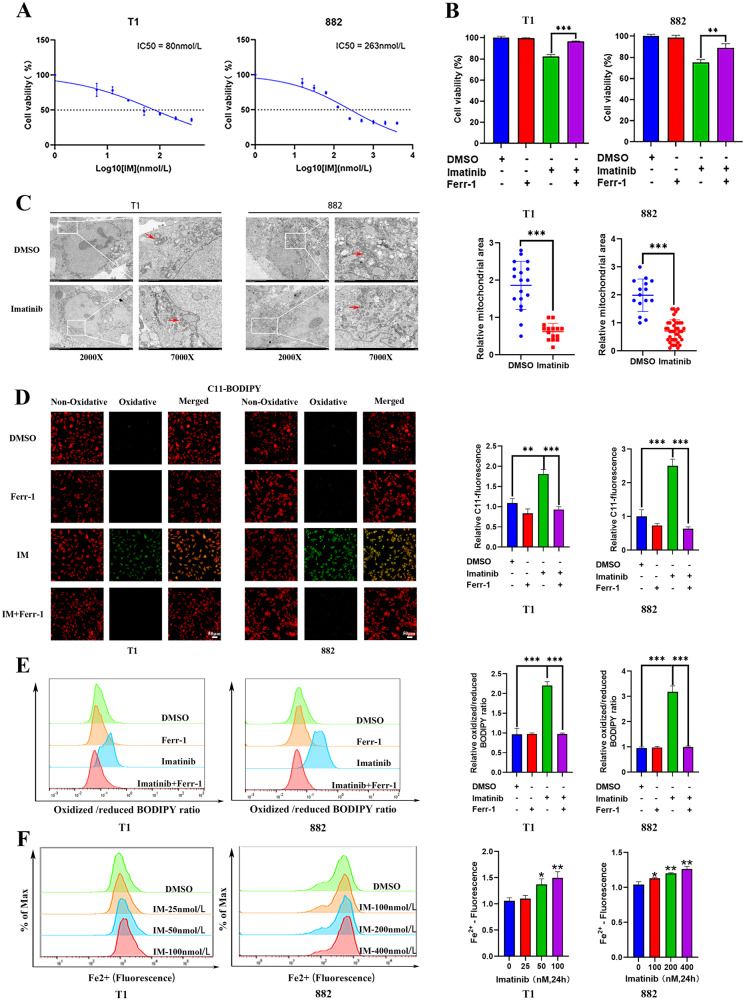
Fig. 1. Imatinib (IM) induces ferroptosis in gastrointestinal stromal tumor (GIST) cells.
A GIST-T1 and 882 cells were treated with different concentrations of IM for 24 h and the IC50 of IM was determined. B GIST-T1 and 882 cells were treated with IM (50 nM for T1 and 200 nM for 882) for 24 h in the absence or presence of Ferrostatin-1 (1 μM), and the cell viability was assayed. C Cell morphology was observed via transmission electron microscopy after the cells were treated with IM (50 nM for T1 and 200 nM for 882) for 24 h. The area of mitochondria are quantitatively analyzed by using the ImageJ software. D, E GIST-T1 and 882 cells were treated with IM (50 nM for T1 and 200 nM for 882) in the absence or presence of Ferr-1 (1 μM) for 12 h, the relative lipid ROS levels were measured using a C11-BODIPY lipid peroxidation sensor via confocal microscope (D) and flow cytometry (E). In fluorescence images, the increase in lipid ROS levels resulted in the oxidation of the polyunsaturated butadienyl portion of C11-BODIPY, causing a shift in fluorescence from red to green. Flow cytometry analysis utilized the FITC filter for oxidized C11-BODIPY (emission: 510 nm) and the PE-TexasRed filter for reduced C11-BODIPY (emission: 590 nm). The results are presented as a ratio of oxidized to reduced C11-BODIPY. F GIST-T1 and 882 cells were treated with IM at 0, 25, 50, and 100 nM and 0, 100, 200, and 400 nM for 24 h, and the relative levels of Fe2+ were assayed. Scale bar, 50 μm in D. Experiments were independently repeated three times. Significance denoted by: ns not significant, *P < 0.05, **P < 0.01, and ***P < 0.001.

