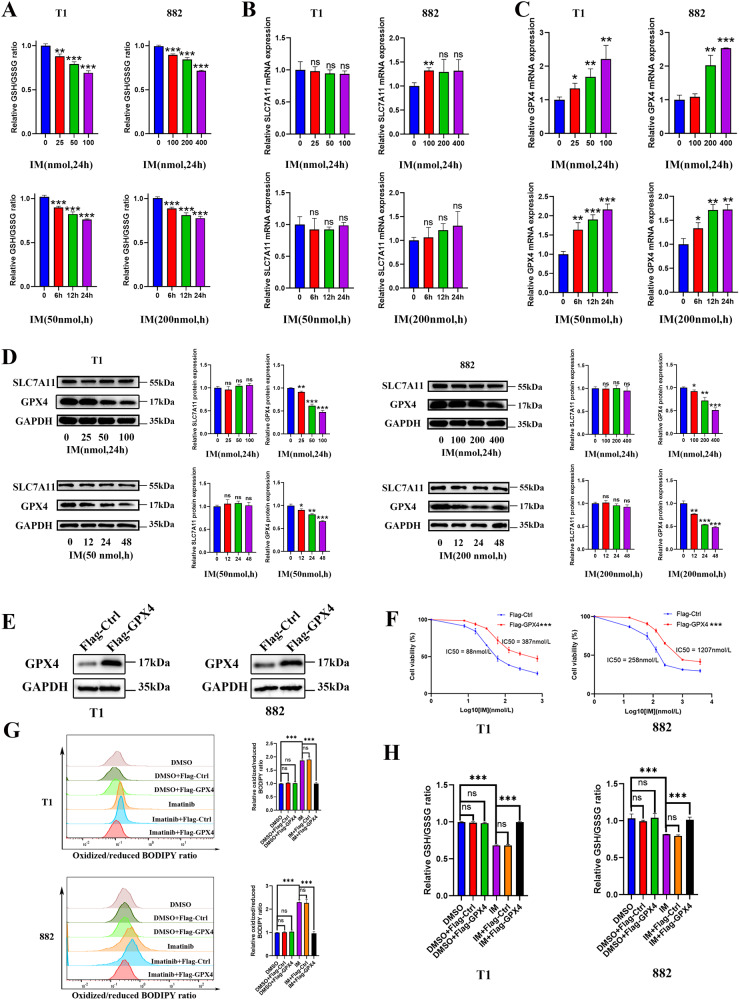
Fig. 2. Imatinib (IM) induces ferroptosis by causing GPX4 degradation.
A GIST-T1 and 882 cells were treated with IM at 0, 25, 50, and 100 nM and 0, 100, 200, and 400 nM for 24 h or treated with IM (50 nM for T1 and 200 nM for 882) for 0, 6, 12, or 24 h, and the relative GSH/GSSG ratios were assayed. B and C The relative RNA level of SLC7A11 and GPX4 was measured via quantitative real-time polymerase chain reaction after GIST-T1 and 882 cells were treated with IM at 0, 25, 50, and 100 nM and 0, 100, 200, and 400 nM for 24 h or treated with IM (50 nM for T1 and 200 nM for 882) for 0, 6, 12, or 24 h. D Representative Western blot analysis of SLC7A11 and GPX4 protein levels in GIST-T1 and 882 cells. The cells were treated with IM at 0, 25, 50, and 100 nM and 0, 100, 200, and 400 nM for 24 h or treated with IM (50 nM for T1 and 200 nM for 882) for 0, 12, 24, or 48 h. The histograms indicate the levels of the protein determined from 3 independent experiments expressed as the mean ratio relative to that in the untreated control after normalization to GAPDH. E Western blot analysis of GPX4 in GIST-T1 and 882 cells with GPX4 overexpression. F GIST-T1 and 882 cells were treated with IM (50 nM for T1 and 200 nM for 882) for 24 h with or without the overexpression of GPX4, and cell viability was assayed. G GIST-T1 and 882 cells were treated with IM (50 nM for T1 and 200 nM for 882) for 12 h with or without the overexpression of GPX4, and the relative lipid ROS levels were assayed via flow cytometry. Flow cytometry analysis was performed using the FITC filter for oxidized C11-BODIPY (emission: 510 nm) and the PE-TexasRed filter for reduced C11-BODIPY (emission: 590 nm). The results are displayed as a ratio of oxidized/reduced C11-BODIPY. H GIST-T1 and 882 cells were treated with IM (50 nM for T1 and 200 nM for 882) for 24 h with or without the overexpression of GPX4. The relative GSH/GSSG ratios were assayed. Experiments were independently repeated three times. Significance denoted by: ns not significant, *P < 0.05, **P < 0.01, and ***P < 0.001.

