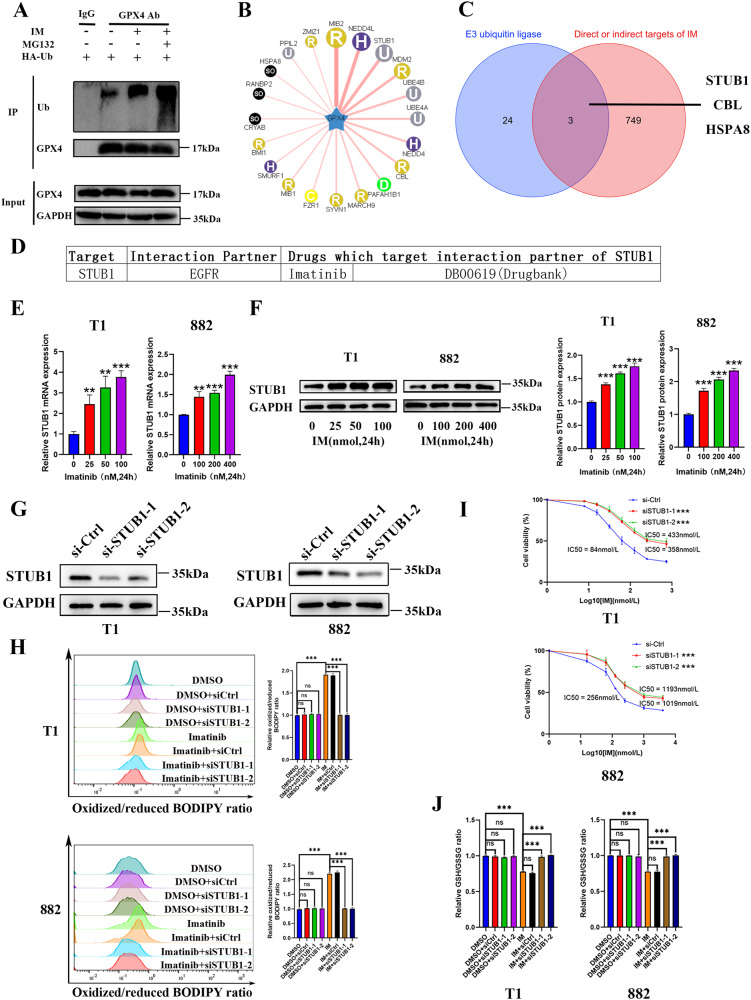
Fig. 3. Imatinib (IM) induces ferroptosis by regulating the E3 ubiquitin ligase STUB1.
A GIST-T1 cells were treated with IM (50 nM) for 24 h with or without MG132 (5 μM), and GPX4 ubiquitination was measured via CO-IP. B Bioinformatics prediction of the interaction between the GPX4 and multiple E3 ubiquitin ligases using the UbiBrowser website (http://ubibrowser.ncpsb.org.cn). C Venn diagram depicting that the predicted E3 ubiquitin ligase STUB1, CBL, and HSPA8 of GPX4 protein may be the targets of IM. D DRUGSURV database (http://www.bioprofiling.de/GEO/DRUGSURV/) analysis revealed that STUB1 is an indirect target of IM. E GIST-T1 and 882 cells were treated with IM at 0, 25, 50, and 100 nM and 0, 100, 200, and 400 nM for 24 h, and RNA expression of STUB1 were measured. F Representative Western blot analysis of STUB1 protein levels in GIST-T1 and 882 cells. The cells were treated with IM at 0, 25, 50, and 100 nM and 0, 100, 200, and 400 nM for 24 h, and subjected to Western blot analysis. The histograms indicate the levels of the protein determined from three independent experiments expressed as the mean ratio relative to that in the untreated control after normalization to GAPDH. G Western blot analysis of STUB1 in GIST-T1 and 882 cells transfected with siRNA-control, siRNA-STUB1–1 and siRNA-STUB1–2. H GIST-T1 and 882 cells were treated with IM (50 nM for T1 and 200 nM for 882) for 12 h with or without STUB1 knockdown, and the relative lipid ROS levels were assayed via flow cytometry. Flow cytometry analysis was performed using the FITC filter for oxidized C11-BODIPY (emission: 510 nm) and the PE-TexasRed filter for reduced C11-BODIPY (emission: 590 nm). The results are displayed as a ratio of oxidized/reduced C11-BODIPY. I GIST-T1 and 882 cells were treated with IM (50 nM for T1 and 200 nM for 882) for 24 h with or without STUB1 knockdown. Cell viability was assayed. J GIST-T1 and 882 cells were treated with IM (50 nM for T1 and 200 nM for 882) for 24 h with or without STUB1 knockdown. The relative GSH/GSSG ratios were assayed. Experiments were independently repeated three times. Significance denoted by: ns not significant, *P < 0.05, **P < 0.01, and ***P < 0.001.

