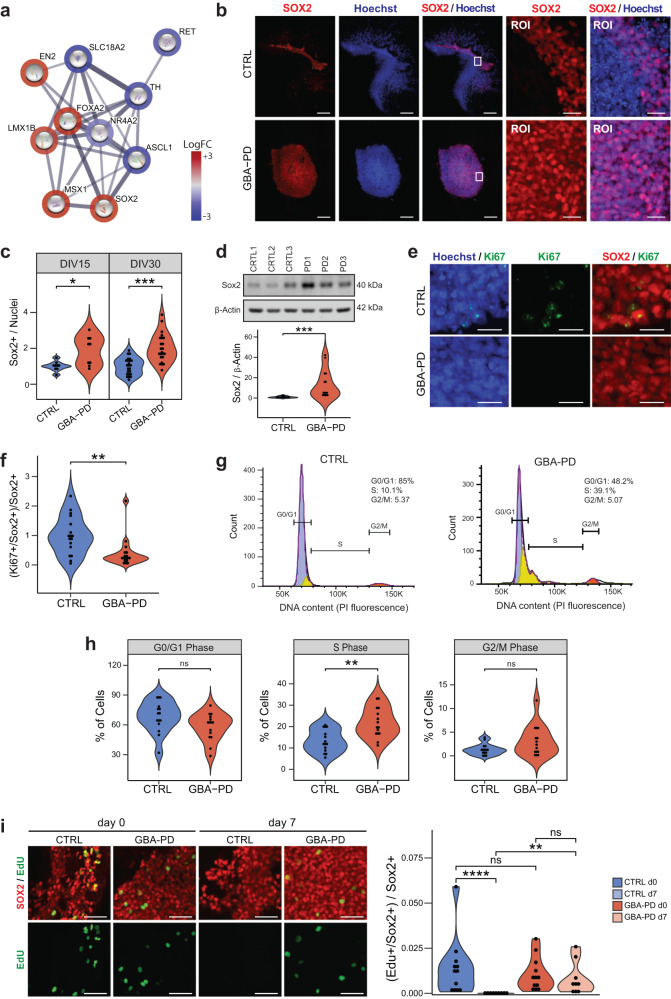
Fig. 5. Increased levels of SOX2 and cell cycle arrest in GBA-PD organoids.
a DEGs involved in dopaminergic differentiation (PathCards) depicted via protein–protein associations obtained from the STRING database. The border of the nodes represents the log fold-change (logFC) of the gene expression in the comparison of control GBA-PD organoids vs controls. Edges depict protein–protein associations. b Representative immunofluorescence staining of SOX2 (red) in midbrain organoid sections at DIV15 (CTRL1 and PD1), along with an amplified region of interest (ROI) of the original. Nuclei stained with Hoechst 33342 (blue), scale bar is 200 μm and 25 μm, respectively. c Quantitative analyses of SOX+ population shows increased proportion of cells expressing the neural stem cell marker in GBA-PD MOs at DIV15 and DIV30. Each data point represents the average of technical replicates for each independent differentiation. Values are normalized to the mean of the controls per experiment. Wilcoxon T-test; *p < 0.05, **p < 0.01, n = 3. d Validation of the immunofluorescence results by immunoblotting against SOX2 in whole cell lysates obtained from organoids at DIV15. The data represent a summary of four independent differentiations. Values are normalized to the mean of the controls per experiment. Wilcoxon T-test; ***p < 0.001. e Representative images CTRL2 and PD2 expressing SOX2 (red) and Ki67(green) at DIV15. Nuclei stained with Hoechst 33342 (blue) (scale bar, 20 μm). f Decreased proportion of proliferative neural stem cells in mutant MOs (DIV30) compared to controls, represented by cells expressing both SOX2 and Ki67. Values are normalized to the mean of the controls per experiment. Wilcoxon T-test; *p < 0.05. g, h Propidium iodide (PI) fluorescence profiles of CTRL3 and PD3 with cell cycle distribution (Watson pragmatic model) (G). Percentage of cells in each cycle phase analyzed by flow cytometry using propidium iodide showing accumulation of cells in the S-phase at DIV30 in GBA-PD organoids. The experiment was repeated five times using organoids from five independent differentiations. Wilcoxon T-test; *p < 0.05. i Representative images (left) of EdU staining (green) for evaluation of the proliferation of SOX+ neural precursors (red) at the day of the exposure (day 0) and 7 days after the initial exposure to EdU (day 7). Images correspond to organoids at DIV30 of CTRL1 and PD1 cell lines (scale bar, 50 μm). Respective quantification (right) of the proportion of neural precursors with a positive signal for EdU showing a significant loss of the EdU staining in CTRL organoids at day 7 after EdU exposure. Data represents a summary of at least three independent differentiation experiments. Kruskal–Wallis with post hoc Dunn tests; **p < 0.01, ****p < 0.0001.

