
Figure 3.
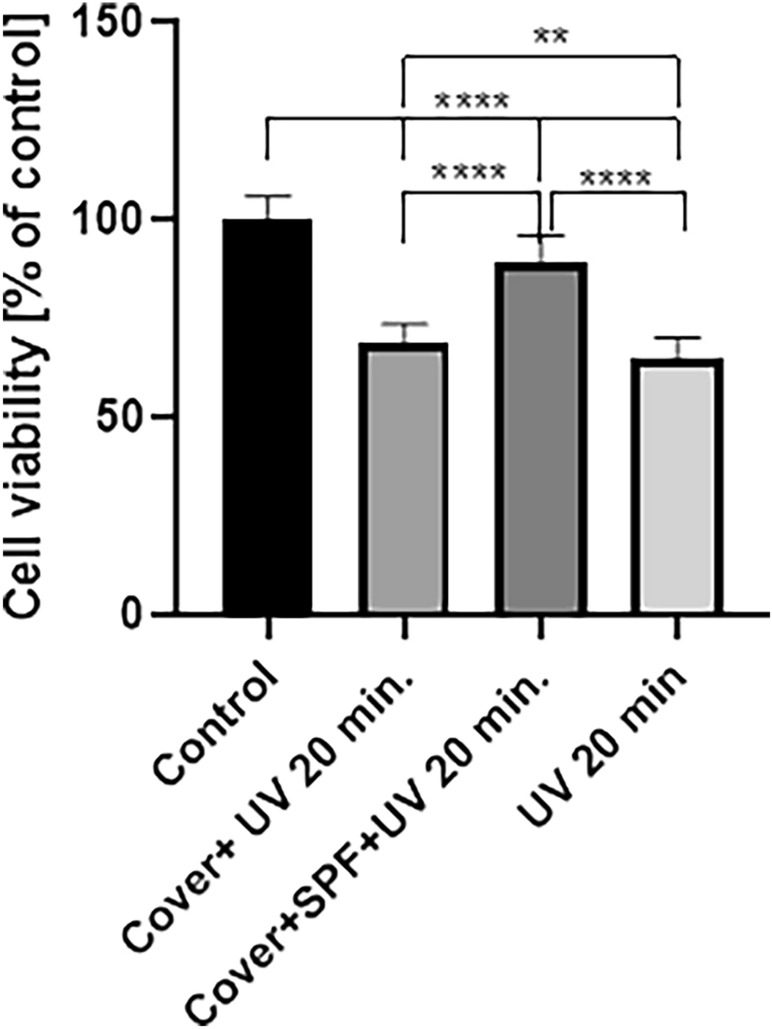
Cell viability of HaCat cells treated with 20 min of UV light. Values are mean ± SE of three independent experiments Cell viability assy. Values are mean ± SE of three independent experiments. Data were analyzed with GraphPad Prism Software version 8.0.1 using bidirectional ANOVA with Tukey's multiple comparisons tests; **p < 0.01, ****p < 0.0001 versus control. The results for the ANOVA test were: p < 0.0001, F = 511.1, total degree of freedom = 239.