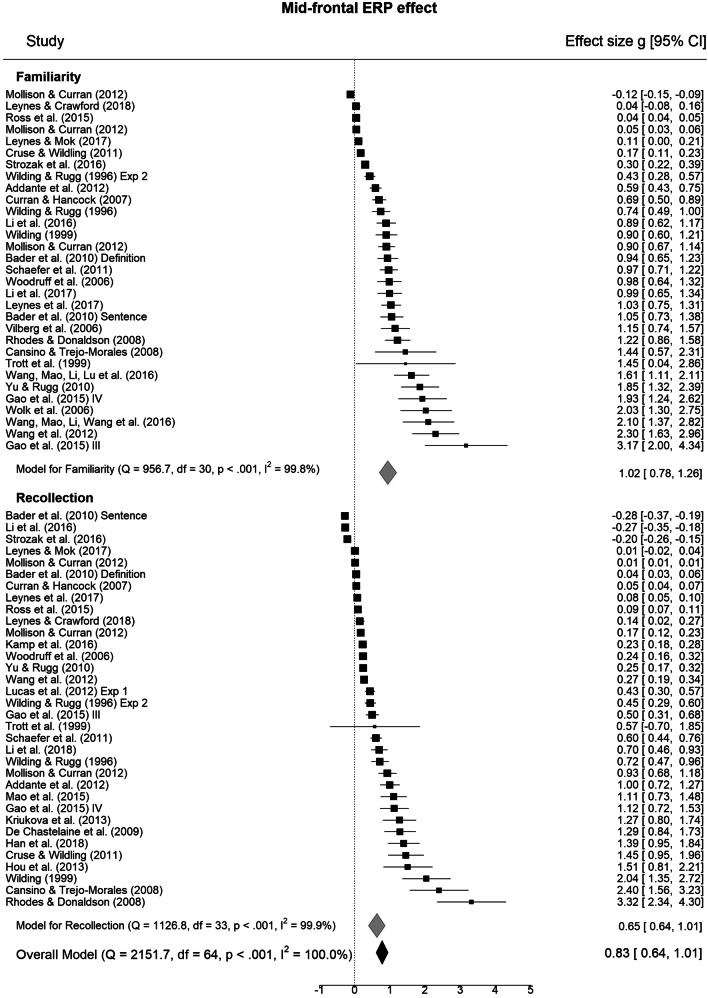
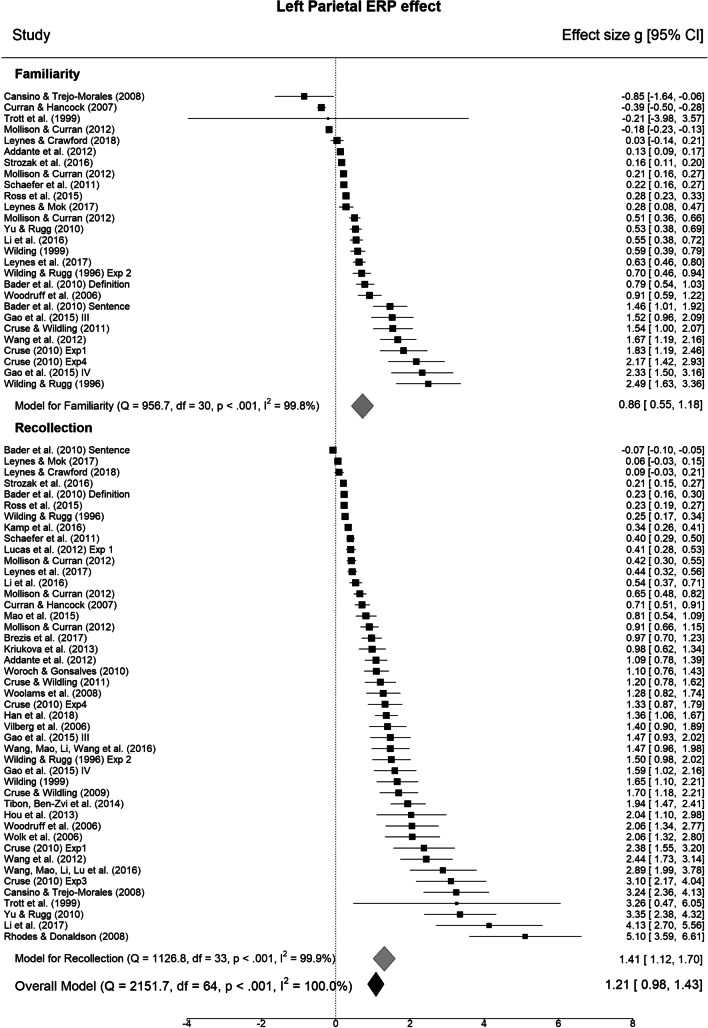
Fig. 2.
Forest plots for mid-frontal and parietal event-related potential (ERP) effects. Individual study values (filled squares) represent standardized mean differences (effect sizes) for ERP effects. The overall meta-analytic effect size across all contrasts is given below (filled black diamond) with model statistics. Subgroup model statistics and meta-analytic effect sizes are plotted separately for familiarity and recollection contrast subgroups. Error bars represent 95% confidence intervals. For definitions of quantities see Methods – Meta-analysis


