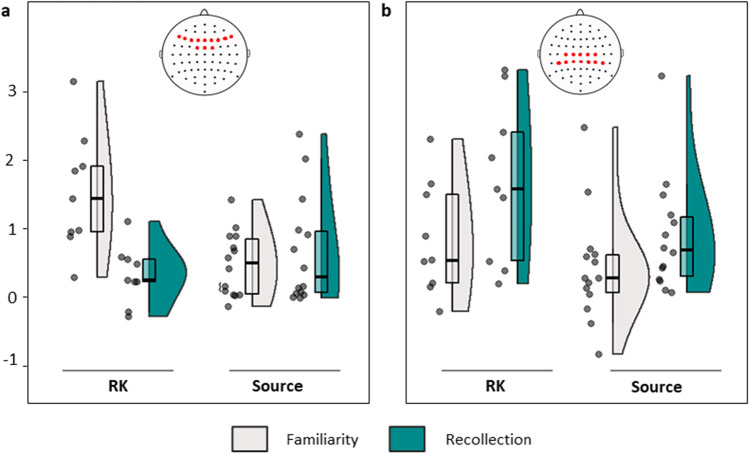
Fig. 4.
Interaction plot of effect sizes by experimental paradigm and process for each event-related potential (ERP) effect. (a) Mid-frontal ERP effect. (b) Parietal effect. Filled circles show effect sizes (Hedge’s g) for each study, shaded areas show the probability density function of the data, and boxplots show the median and interquartile range. Insets illustrate the electrode inclusion criteria for each effect (see Methods – Inclusion criteria)

