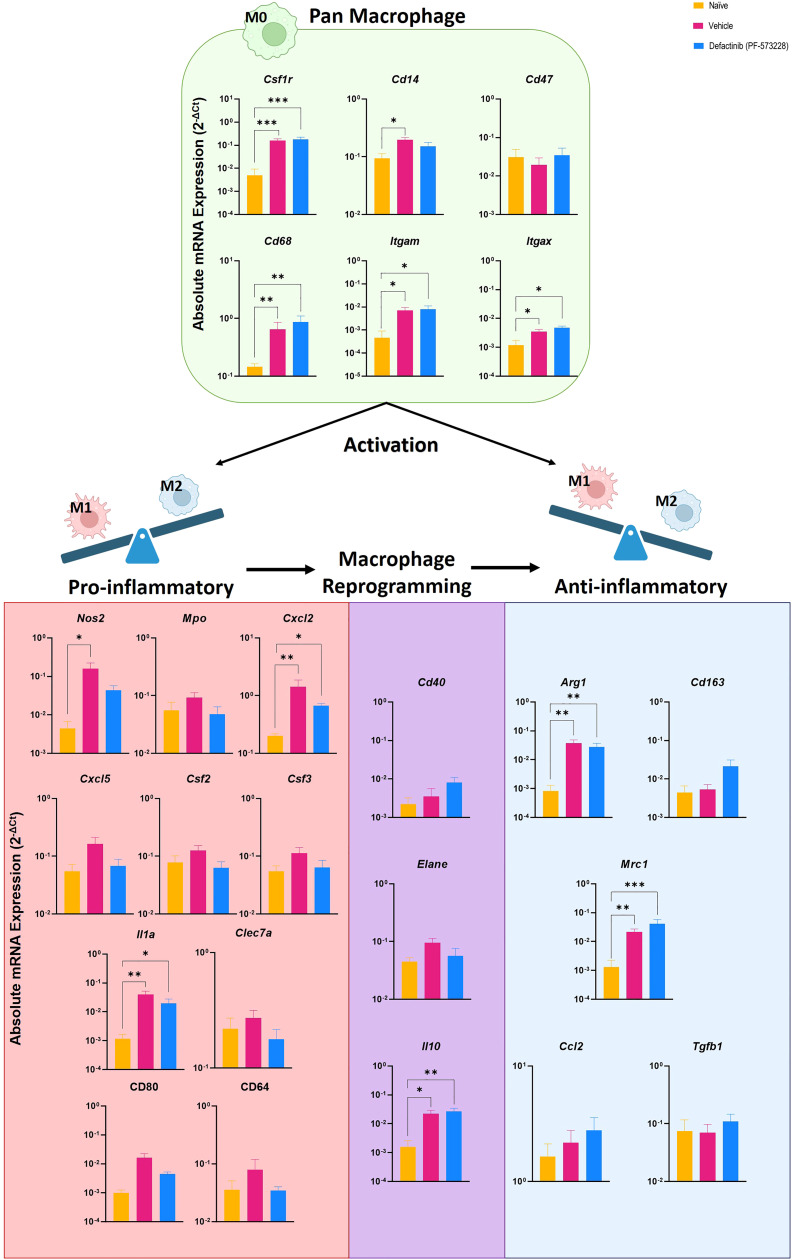
Figure 5.
Level of pan-macrophage, classic proinflammatory M1 and alternative activated anti-inflammatory M2 gene markers expressed in cellular infiltrates collected from injured muscle tissue at POD-7 from rats treated with the FAK2 inhibitor (PF-573228,10 mg/kg/day, 6.94 µg/kg/min), vehicle control and in healthy muscle from age-matched controls. Relative expression (2-ΔCt) was calculated using an optimal normalization strategy. One-way ANOVAs for each gene were conducted on ΔCt values to determine treatment effects. Tukey-Kramer post-hoc analyses were utilized to determine the source of the significance. Data represents mean relative expression values ± SEM. * indicates p < 0.05, **indicates p < 0.01 ands *** indicates p < 0.001.

