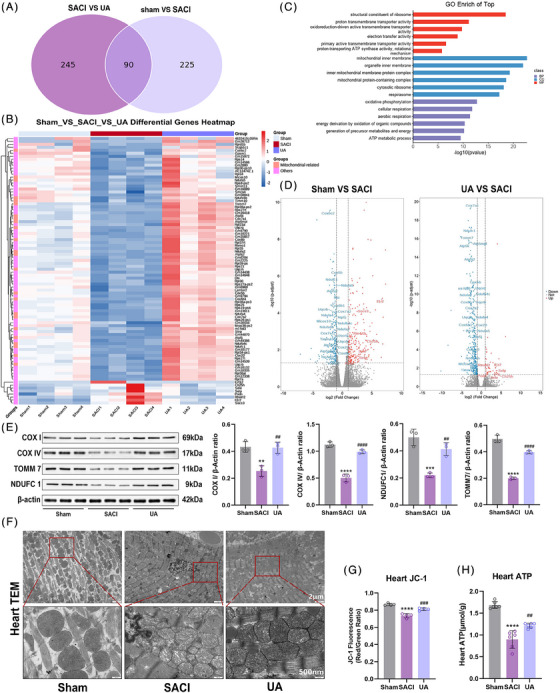
FIGURE 2.

Effect of Urolithin A on mitochondria‐related genes in SACI mice. (A) Venn diagram of gene expression in sham group vs. SACI group and SACI group vs. UA group. (B) Heatmap analysis of 90 overlapping gene expressions in three groups (n = 4). (C) GO term analysis of 90 overlapping gene expressions in the SACI group vs. UA group. (D) Volcano plots of differential genes in the sham group vs. SACI group and UA group vs. SACI group. (E) Western blotting and quantitative analysis of COX I, COX IV, TOMM7, and NDUFC1 in cardiac tissues of the sham, SACI, and UA groups (n = 3). (F) Representative transmission electron microscopy (TEM) images of cardiac tissues in the sham, SACI, and UA groups (scale bar = 2 μm; 500 nm). (G) Mitochondrial membrane potential changes in isolated purified heart mitochondria in the sham, SACI, and UA groups. (JC‐1 fluorescence: red/green ratio; n = 4). (H) Changes in total ATP concentration in heart tissues in the sham, SACI, and UA groups (n = 6). The results are presented as the mean ± SD. **p < 0.01, ***p < 0.005, ****p < 0.0001 vs. sham group; ##p < 0.01, ###p < 0.005, ####p < 0.0001 vs. SACI group, by one‐way ANOVA tests followed by Tukey tests.
