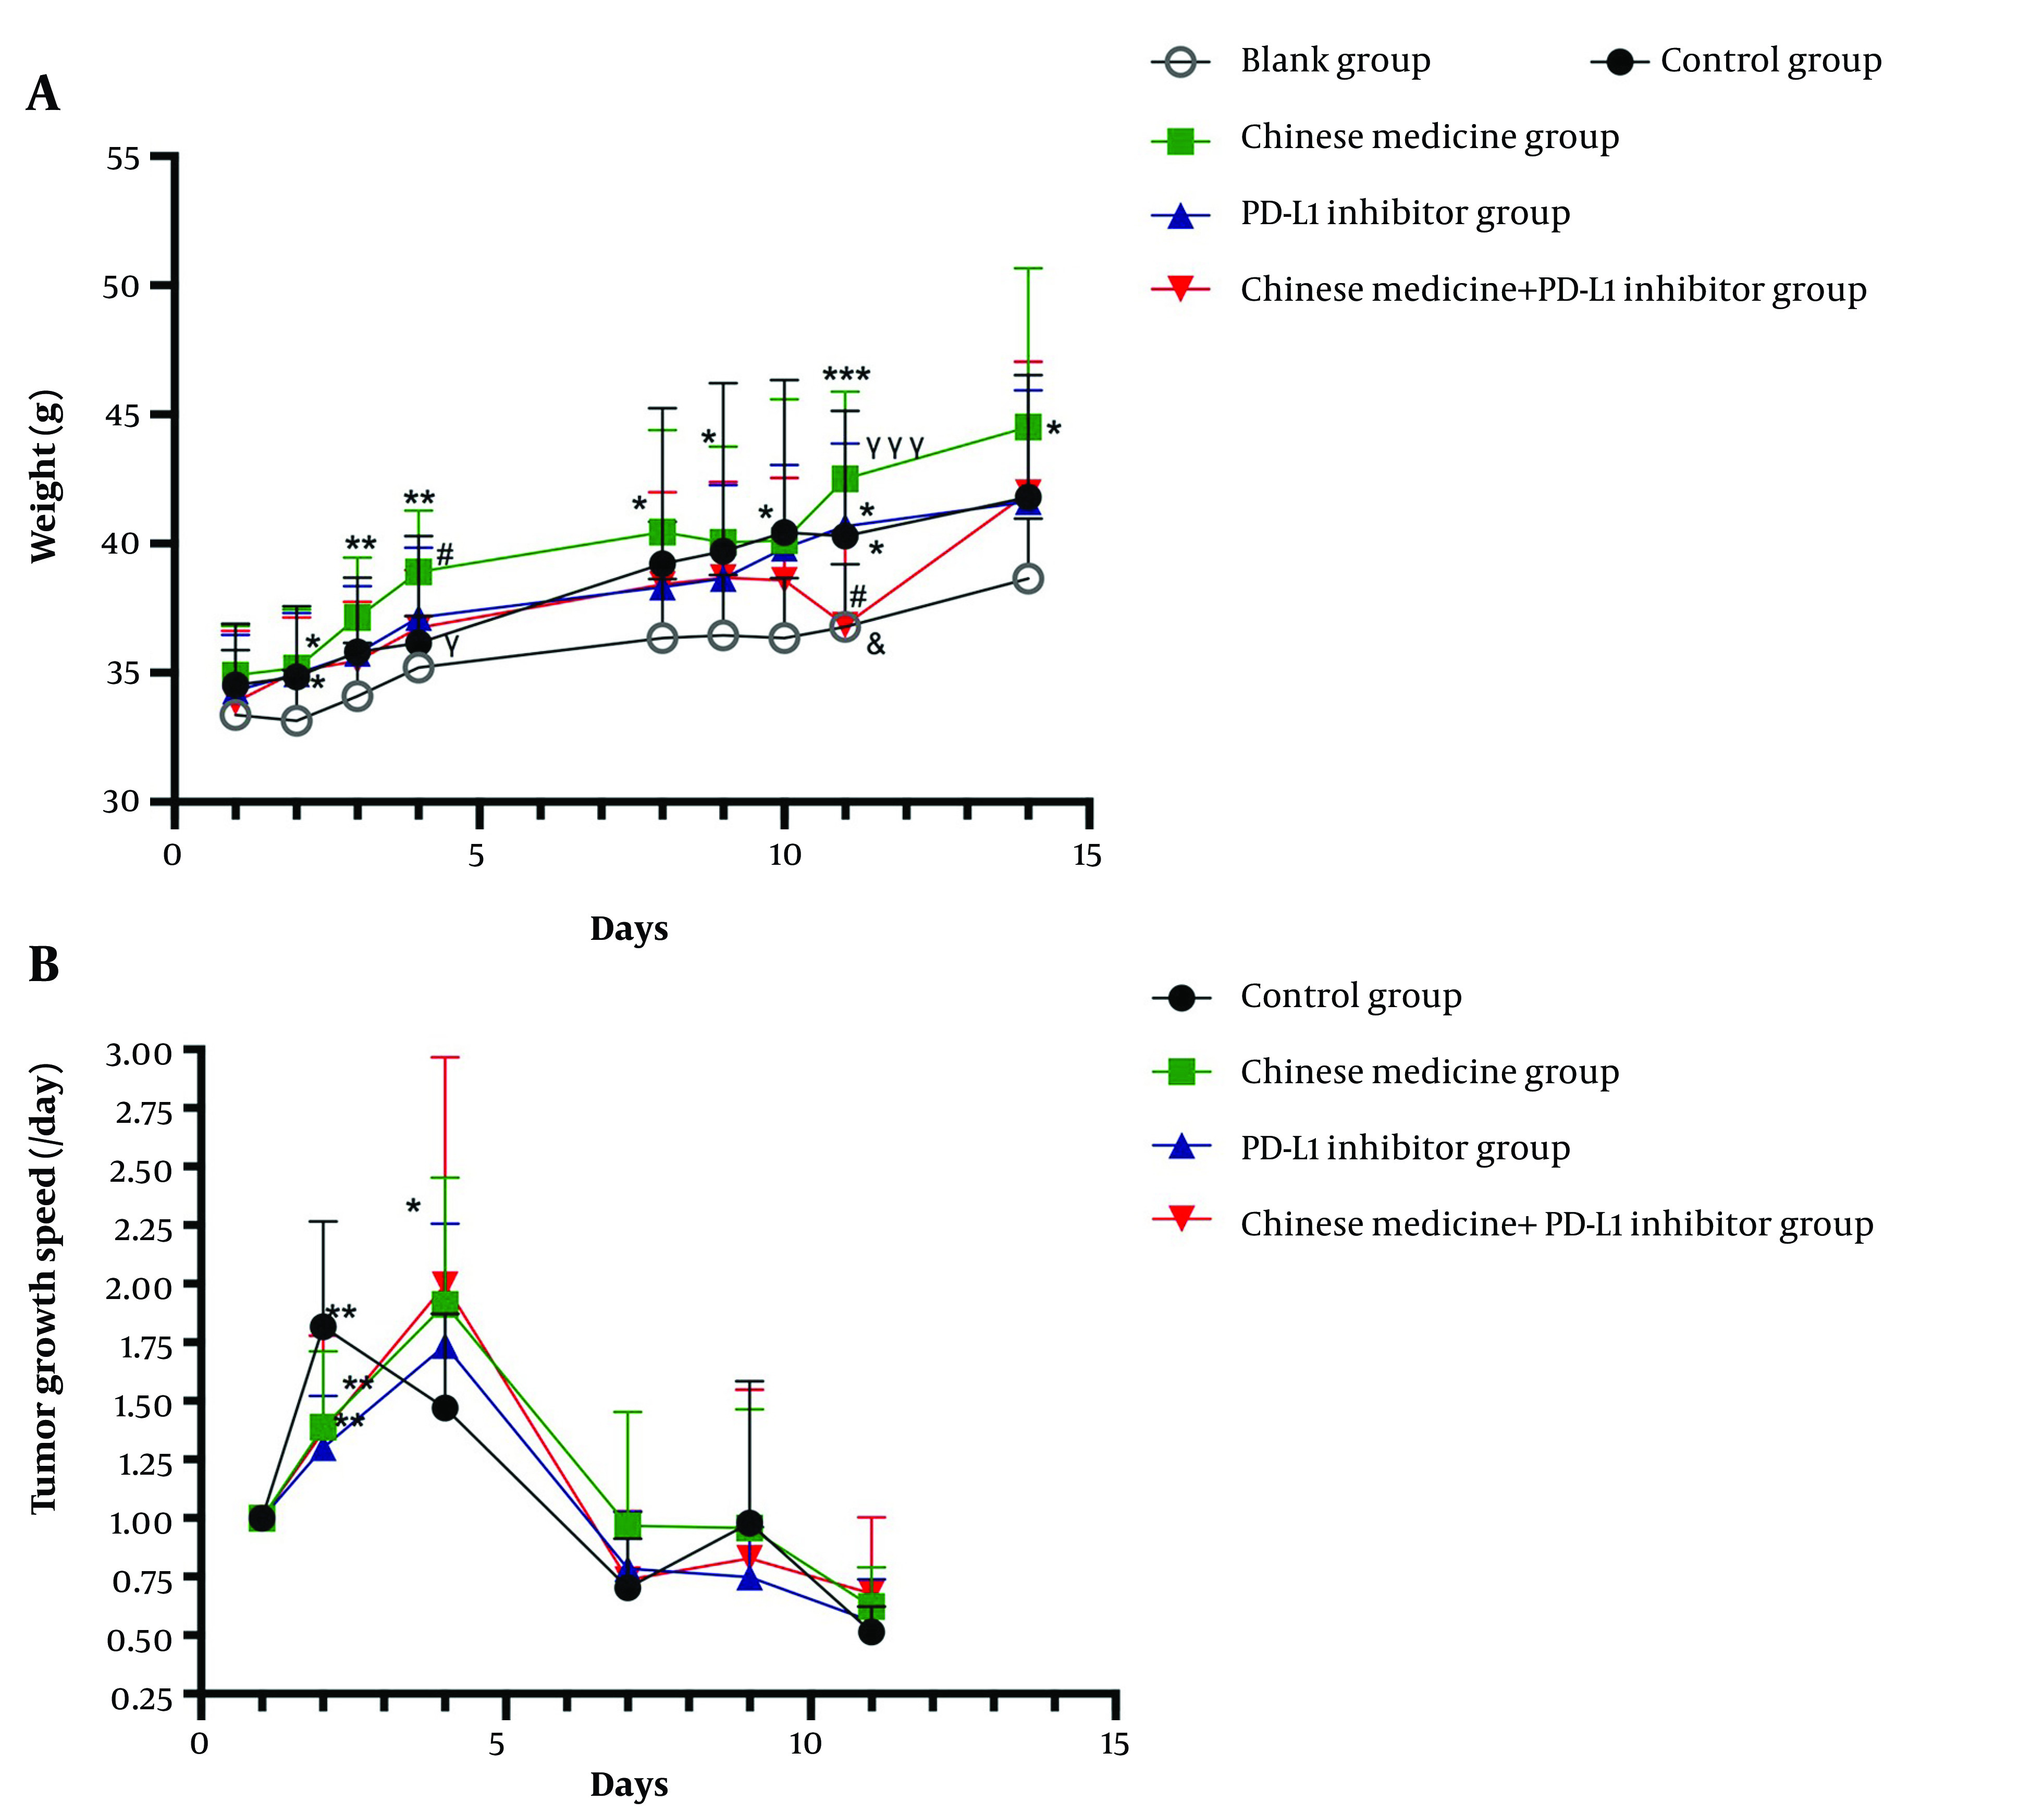
Figure 1. A, Weight changes in all groups. B, Tumor growth rates in each tumor-bearing mice group. * Compared with the Blank group; # compared with the Control group; γ compared with the Chinese medicine group; & compared with the PD-L1 inhibitor group. *P ≤ 0.5, **P ≤ 0.01, ***P ≤ 0.001 (similarly hereinafter).

