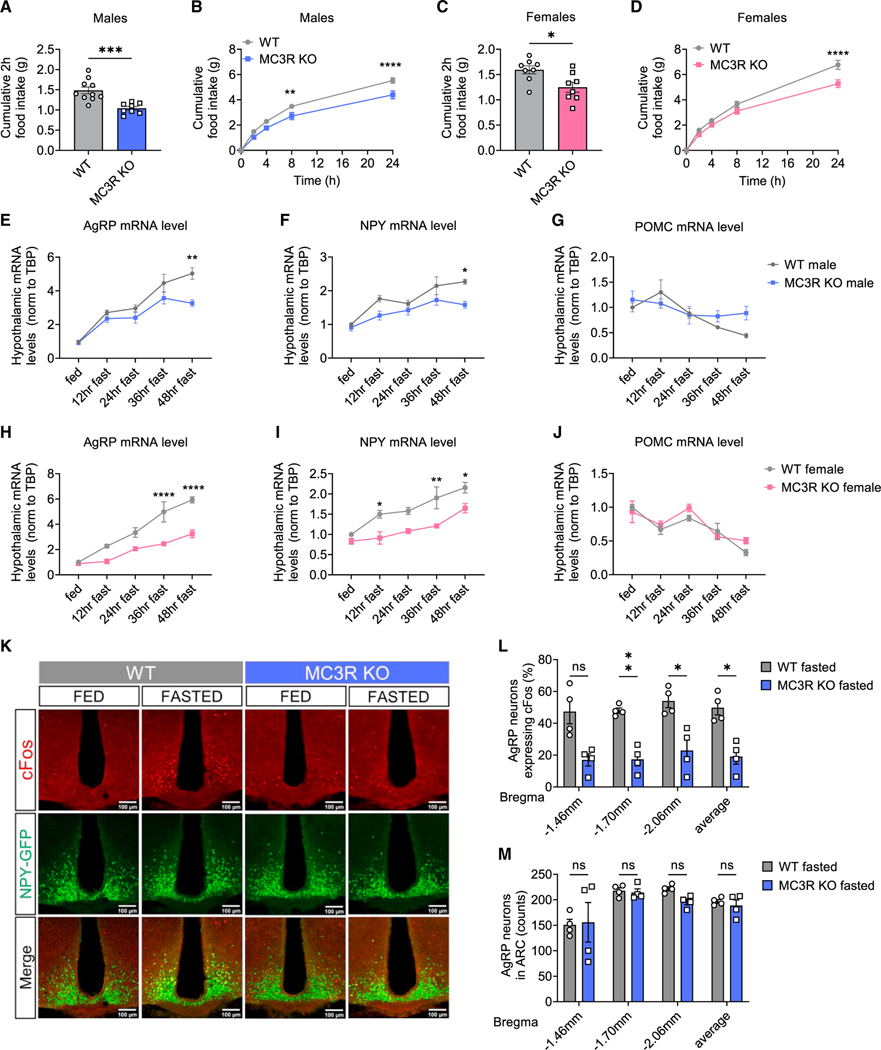
Figure 1. MC3R is required for the activation of AgRP neurons by fasting.
(A‒D) 2- (A and C) and 24-h (B and D) food intake of WT and MC3R KO male and female mice following a 24-h fast (n = 8–10 mice for all groups).
(E‒J) qPCR analysis of hypothalamic AGRP, NPY, and POMC mRNA levels in WT and MC3R KO male and female mice over a 48-h-fasting time course (n = 3–9 mice for all groups).
(K‒M) Representative images of GFP and cFos immunostaining, and quantifications of the percentage of cFos-positive GFP cells and the number of GFP cells in the ARC of 24-h-fasted WT and MC3R KO NPY-GFP male mice.
Scale bar, 100 μm (n = 4 mice for all groups). Data are plotted as mean, and all error bars represent the SEM. ns, non-significant; *p < 0.05; **p < 0.01; ***p < 0.001; ****p < 0.0001 in unpaired Student’s t test and two-way ANOVA with Sidak’s post hoc test.

