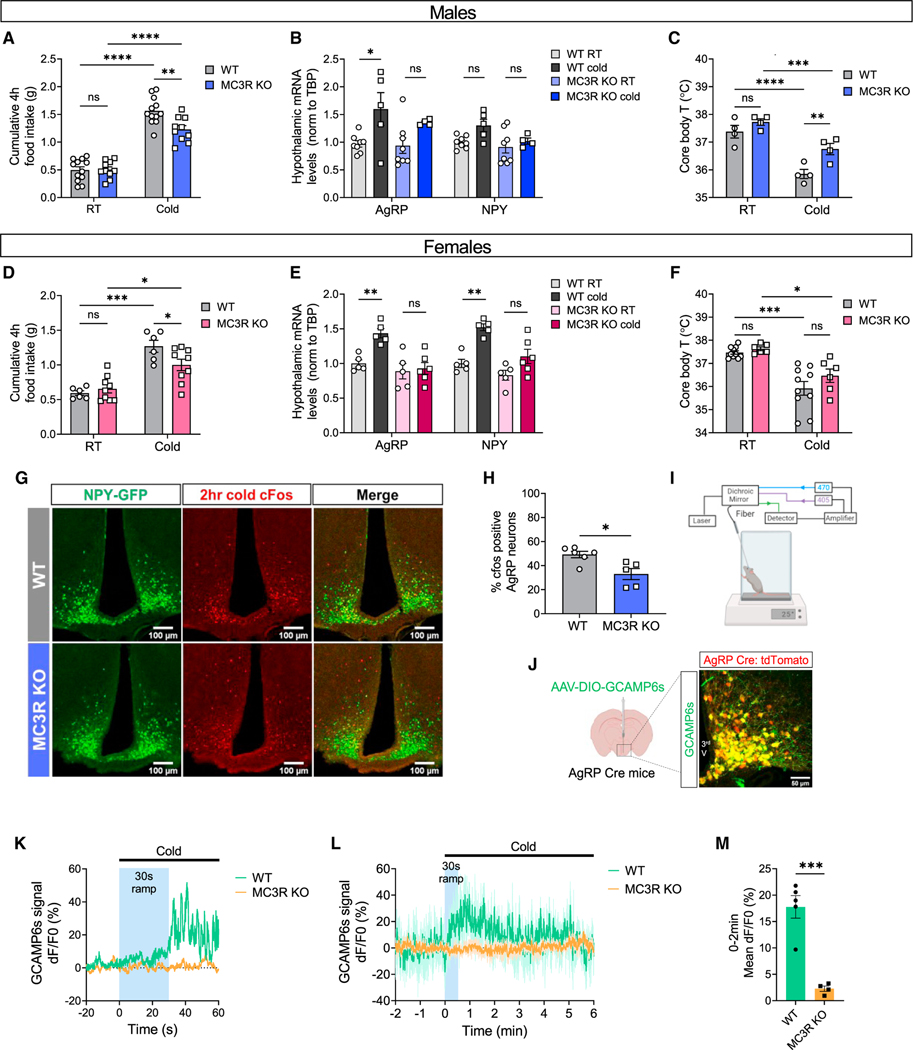
Figure 2. MC3R is required for the activation of AgRP neurons in response to cold.
(A and D) 4-h food intake of WT and MC3R KO male and female mice under room temperature (RT; 22°C) or cold exposure (4°C) (n = 6–12 mice for all groups). (B, C, E, and F) qPCR analysis of hypothalamic AGRP and NPY mRNA levels (B and E) and measurement of rectal temperature (C and F) in WT and MC3R KO male and female mice under RT or following 4-h cold exposure (n = 4–10 mice for all groups).
(G and H) Representative images of GFP and cFos immunostaining, and quantifications of the percentage of cFos-positive GFP cells in the ARC of WT and MC3R KO NPY-GFP male mice following 2-h cold exposure. Scale bar, 100 mm (n = 5–6 mice for each group).
(I) Schematic showing the setup of fiber photometry on a cold plate.
(J) Validation of Cre-dependent GCAMP6s viral expression in AgRP Cre:tdTomato mice. Scale bar, 50 μm.
(K) Representative calcium signal traces from one WT mouse and one MC3R KO male mouse in response to cold exposure for 60 s. −20 to 0 s, 22°C; 0 to 60 s, 12°C, with 30-s temperature ramp.
(L and M) Traces and quantifications of averaged dF/F0 (%) GCaMP6s signal in AgRP neurons in WT and MC3R KO male mice during prolonged cold exposure. −2 to 0 min, 22°C; 0 to 6 min, 12°C, with 30-s temperature ramp (n = 5 mice for WT and n = 4 for MC3R KO groups).
Data are plotted as mean, and all error bars represent the SEM. ns, non-significant; *p < 0.05; **p < 0.01; ***p < 0.001; ****p < 0.0001 in unpaired Student’s t test and two-way ANOVA with Sidak’s post hoc test.

