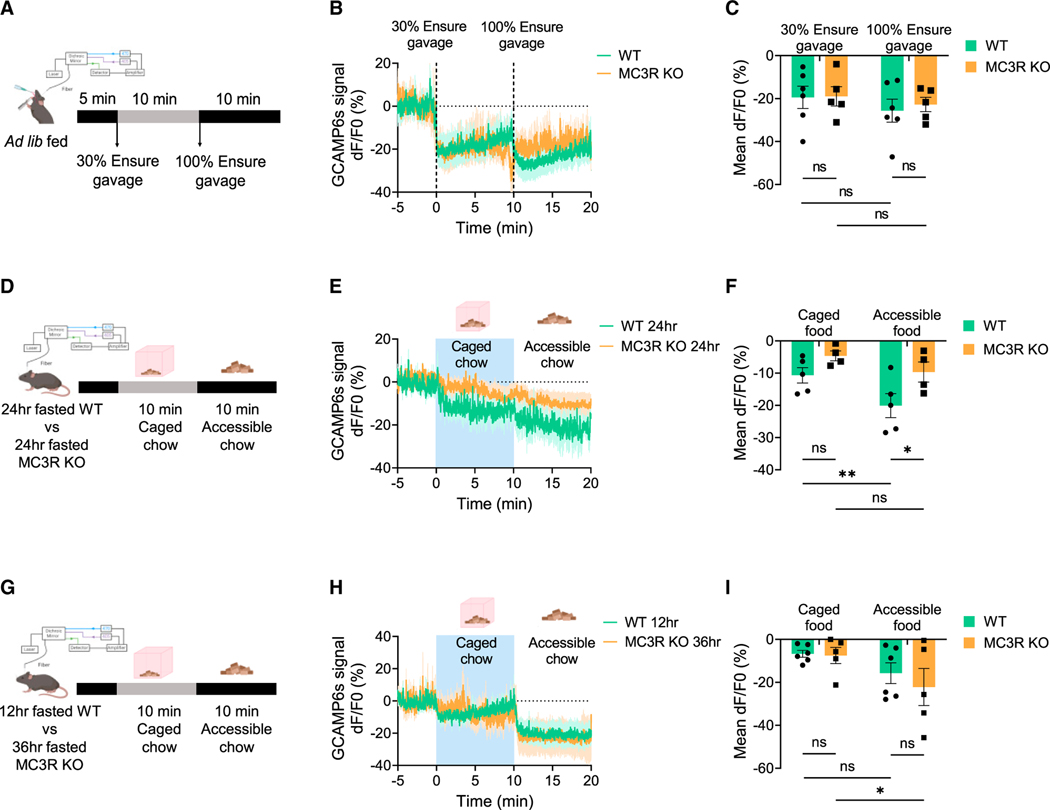
Figure 3. MC3R is not required for the inhibition of AgRP neurons by sensory detection of nutrients or food cues.
(A) Schematic showing the setup of fiber photometry in ad lib-fed male mice in response to 30% or 100% Ensure gavage.
(B and C) Traces and quantifications of averaged dF/F0 (%) GCaMP6s signal in AgRP neurons in ad lib-fed WT or MC3R KO male mice in response to 30% or 100% Ensure gavage (n = 5–6 mice for each group).
(D) Schematic showing the setup of fiber photometry in 24-h-fasted WT or MC3R KO male mice in response to caged or accessible food cues. (E and F) Traces and quantifications of averaged dF/F0 (%) GCaMP6s signal in AgRP neurons in 24-h-fasted WT or MC3R KO male mice in response to caged or accessible food cues (n = 4–5 mice for each group).
(G) Schematic showing the setup of fiber photometry in 12-h-fasted WT or 36-h-fasted MC3R KO male mice in response to caged or accessible food cues. (H and I) Traces and quantifications of averaged dF/F0 (%) GCaMP6s signal in AgRP neurons in 12-h-fasted WT or 36-h-fasted MC3R KO male mice in response to food cues (n = 5–6 mice for each group).
Data are plotted as mean, and all error bars represent the SEM. ns, non-significant; *p < 0.05; **p < 0.01 in two-way ANOVA with Sidak’s post hoc test.

