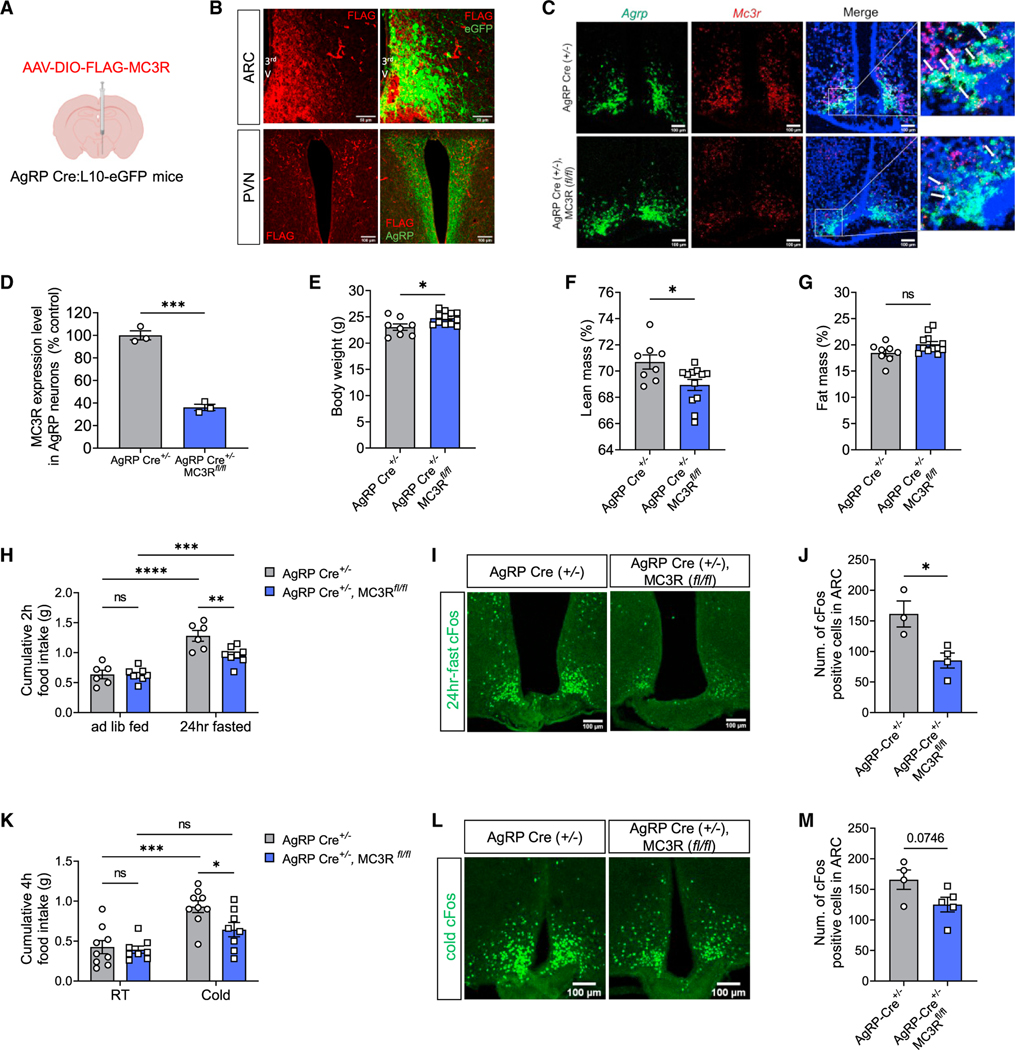
Figure 4. MC3R deletion in AgRP neurons impairs energy deficiency sensing.
(A and B) Validation of Cre-dependent MC3R-FLAG viral expression in AgRP Cre:L10-EGFP mice by immunostaining against FLAG, EGFP, and AgRP. Scale bar, 50 μm for the ARC and 100 μm for the PVN.
(C and D) RNAscope analysis of Mc3r and Agrp mRNA expression, and quantifications of the percentage of AgRP-positive cells coexpressing MC3R in the ARC of AgRP-Cre and AgRP-specific MC3R KO male mice. Scale bar, 100 μm (n = 3 mice for each group).
(E‒G) Body weight and body composition of AgRP-Cre and AgRP-specific MC3R KO male mice (n = 8 mice for AgRP-Cre and n = 12 for AgRP-specific MC3R KO groups).
(H) 2-h food intake of AgRP-Cre and AgRP-specific MC3R KO male mice following a 24-h fast (n = 6 mice for AgRP-Cre and n = 8 for AgRP-specific MC3R KO groups).
(I and J) Representative images of cFos immunostaining, and quantifications of cFos-positive cell number in the ARC of 24-h-fasted AgRP-Cre and AgRP-specific MC3R KO male mice. Scale bar, 100 μm (n = 3 mice for AgRP-Cre and n = 4 for AgRP-specific MC3R KO groups).
(K) 4-h food intake of AgRP-Cre and AgRP-specific MC3R KO male mice under RT (22°C) or cold exposure (4°C) (n = 9 mice for AgRP-Cre and n = 8 for AgRP-specific MC3R KO groups).
(L and M) Representative images of cFos immunostaining, and quantifications of cFos-positive cell number in the ARC of cold-treated AgRP-Cre and AgRP-specific MC3R KO male mice. Scale bar, 100 μm (n = 4 mice for AgRP-Cre and n = 5 for AgRP-specific MC3R KO groups).
Data are plotted as mean, and all error bars represent the SEM. ns, non-significant; *p < 0.05; **p < 0.01; ***p < 0.001; ****p < 0.0001 in unpaired Student’s t test and two-way ANOVA with Sidak’s post hoc test.

