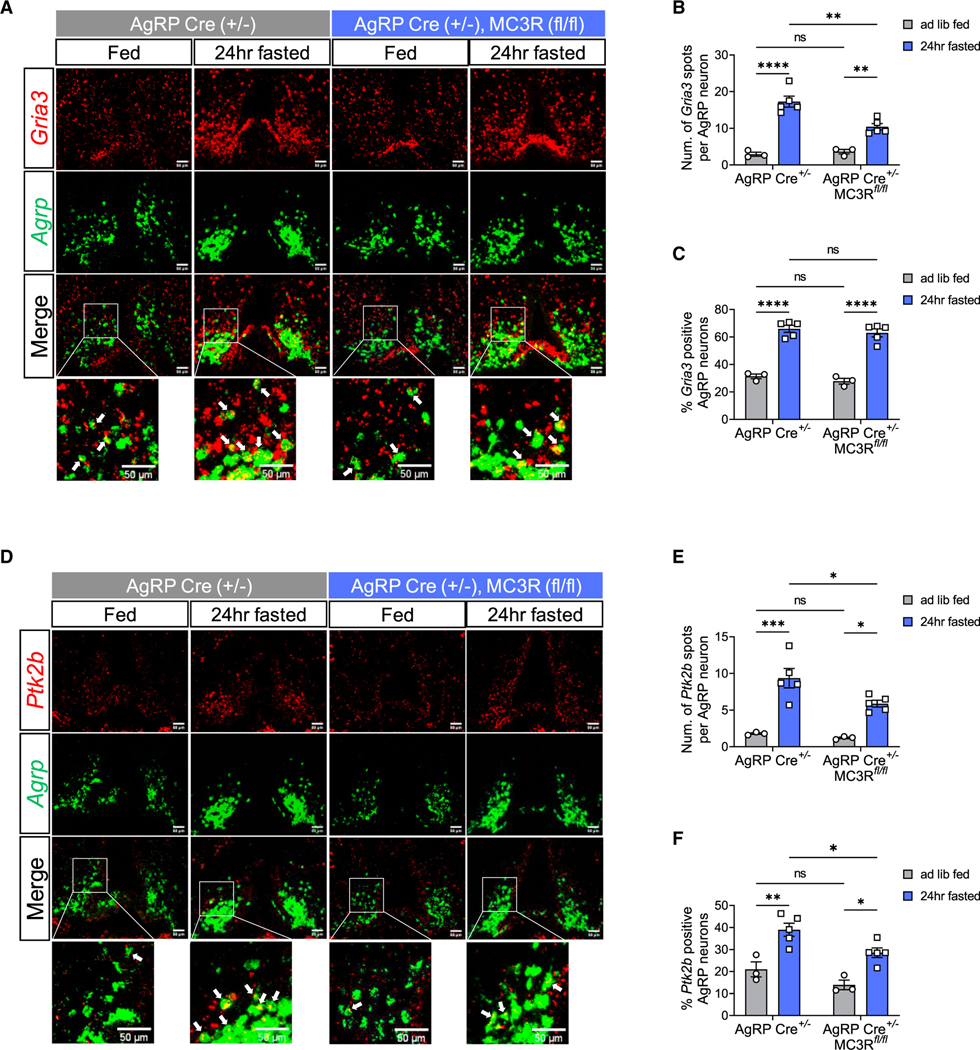
Figure 7. MC3R is required for excitatory synapse-associated gene expression in AgRP neurons.
(A‒C) RNAscope analysis of Agrp and Gria3 mRNA expression, and quantifications of the number of Gria3 transcripts in each AgRP neuron and the percentage of AgRP neurons coexpressing Gria3 in the ARC of fed versus 24-h-fasted AgRP-Cre and AgRP-specific MC3R KO male mice. Scale bar, 50 μm (n = 3–5 mice for all groups).
(D‒F) RNAscope analysis of Agrp and Ptk2b mRNA expression, and quantifications of the number of Ptk2b transcripts in each AgRP neuron and the percentage of AgRP neurons coexpressing Ptk2b in the ARC of fed versus 24-h-fasted AgRP-Cre and AgRP-specific MC3R KO male mice. Scale bar, 50 μm (n = 3–5 mice for all groups).
Data are plotted as mean, and all error bars represent the SEM. ns, non-significant; *p < 0.05; **p < 0.01; ***p < 0.001; ****p < 0.0001 in unpaired Student’s t test and two-way ANOVA with Sidak’s post hoc test.

