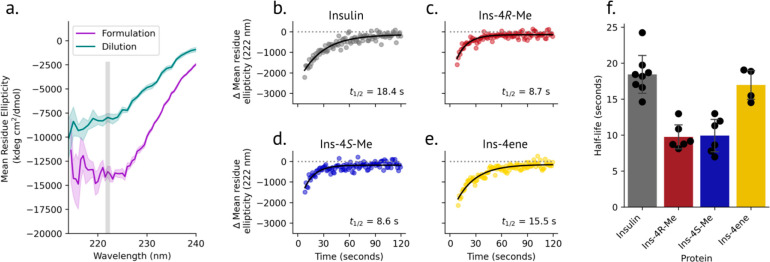
Figure 4.
Hexamer dissociation kinetics of insulin variants. a. Equilibrium CD spectra of insulin before and after dilution. To measure the dissociation kinetics, the decrease in negative ellipticity at 222 nm was monitored over time after dilution. b-e. Representative dissociation plots for insulin (b), ins-4R-Me (c), ins-4S-Me (d), and ins-4ene (e). Each dilution experiment was fit to a monoexponential function, and the half-life for each displayed replicate is indicated. f. Summary of dissociation half-life values.

