Figure 6.
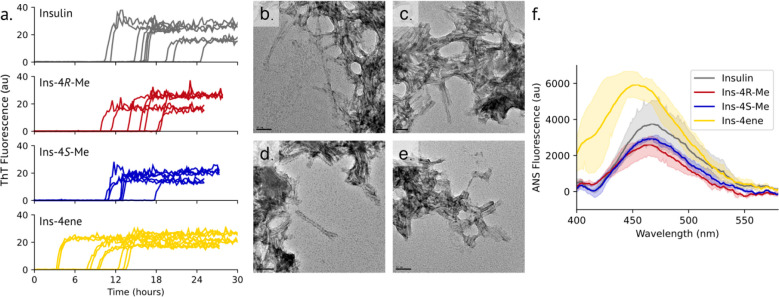
Fibrillation of insulin variants. a. Insulin variants (60 μM in 100 mM phosphate buffer, pH 8.0) were incubated at 37 °C with vigorous shaking, and fibril formation was monitored by ThT fluorescence over time. b-e. Representative TEM images of insulin (b; scale bar: 50 μm), ins-4R-Me (c, 50 μm), ins-4S-Me (d, 100 μm), and ins-4ene (e, 50 μm) aggregates. f. ANS emission spectra of insulin variants (1 μM insulin variant labeled with 5 μM ANS in 100 mM phosphate buffer, pH 8.0).

