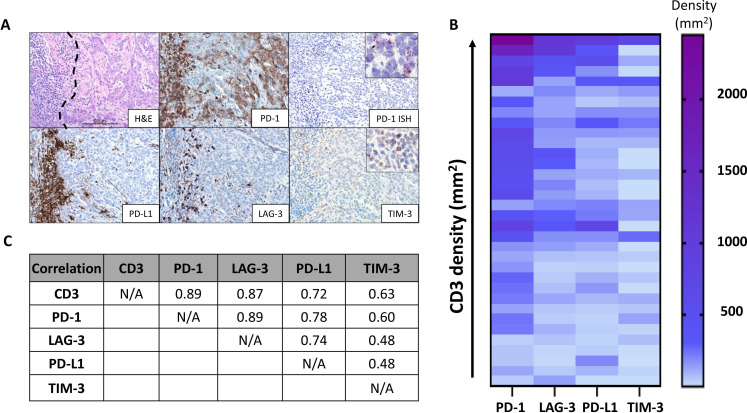
Figure 1.
Patterns of immunoactive marker expression in aggressive basal cell carcinomas (BCCs). (A) Photomicrograph (top left) displaying a representative tumor-immune cell interface within BCC (immune cells on left and tumor on right of black dotted line, H&E staining). Programmed cell death protein-1 (PD-1) immunohistochemistry highlights PD-1 expression by tumor infiltrating lymphocyte (TIL) and tumor cells (TCs) (top middle). PD-1 amplified in-situ hybridization (ISH) was used to verify the PD-1 expression by TCs (top right). Inset shows positive signal in the cytoplasm (red, punctate dots). Programmed death ligand-1 (PD-L1), lymphocyte activation gene 3 (LAG-3), and T-cell immunoglobulin domain and mucin domain 3 (TIM-3) expressions were also present on TIL in this same region. Scale bar=50 µm. (B) Heat map relating CD3+ T-cell densities with PD-1, PD-L1 LAG-3, and TIM-3 lymphocyte expression on a per-specimen basis. Specifically, each row in the heat map represents one specimen from an individual patient. In contrast to the other markers, TIM-3 densities were relatively low and did not associate with an increasing T-cell infiltrate. (C) Pearson’s correlation coefficients, r, showing the strong relationship between CD3, PD-1, and LAG-3 expression.

